DXY The Fine Line Between A Bullish Or Bearish Candle This Month
The difference between a bearish engulfing candle or bullish hammer on the monthly chart is to be decided over the remaining sessions for the year.
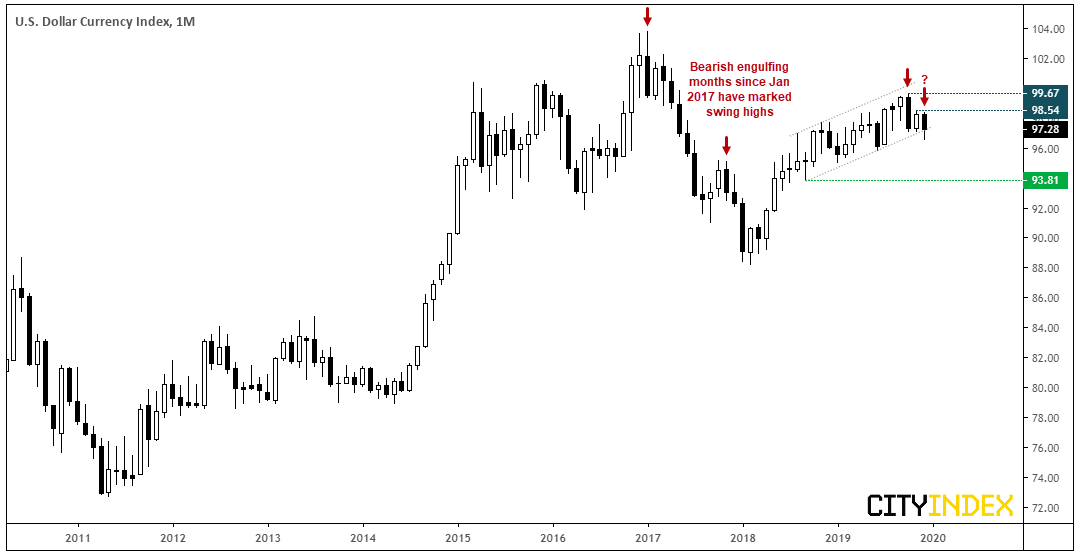
The US dollar is following its seasonal tendency of trading lower through the month of December. Currently around -1%, the USD index (DXY) is on track for a monthly bearish engulfing candle. If this is to occur following October’s bearish outside month (which was its worst month since Jan 2018), it adds weight to the potential that USD has topped out and could be headed lower next year. And this could be the case if the Fed continues to pump money into the money markets and / or launch (actual) QE4 in 2020. On a technical basis, it’s worth noting that the prior two bearish engulfing candles have marked tops on DXY.
However, if global growth fails to revive and the US outperforms the ROW as we saw this year, then we could indeed see a higher USD. Of course, this assumes that the Fed aren’t venturing into QE4 and step away from (not) QE. And then of course, there’s also the US presidential election to factor in. It’s arguable that Trump won’t want a higher USD as we’ll want decent growth figures through the campaign, and that a Democratic lead could also weigh on the dollar. So, there are clearly many moving parts to consider before we can declare whether we’re outright bullish or bearish on the greenback in 2020.
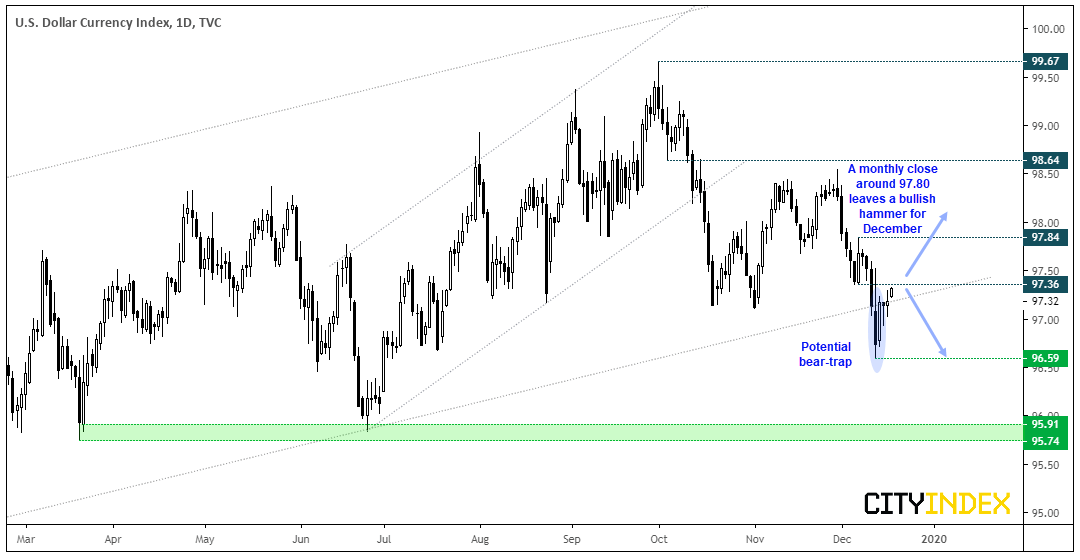
Its fine line between a bullish and bearish candle this month: On the daily chart there are signs of a minor rebound at the very least. Despite falling to a 5-month low and breaking its bullish channel on Thursday, a large bullish inside bar pulled it back towards the trendline and momentum is now starting to turn higher. If it can break above 97.36, the odds of a bear-trap increase and a break above 97.84 suggests its reverted back to its bullish trend. Assuming this occurs before month end, it would invalidate the potential bearish engulfing month and leave a bullish hammer in its wake for traders to mull over in January.
There’s not a huge amount of top tier data between now until the end of the year. Of course, some are worthy of a look such as initial jobless claims, final GDP, consumer sentiment and durable goods. But we may have to rely on outside events and / or month end flows to see the better dollar moves.
StoneX Financial Ltd (trading as “City Index”) is an execution-only service provider. This material, whether or not it states any opinions, is for general information purposes only and it does not take into account your personal circumstances or objectives. This material has been prepared using the thoughts and opinions of the author and these may change. However, City Index does not plan to provide further updates to any material once published and it is not under any obligation to keep this material up to date. This material is short term in nature and may only relate to facts and circumstances existing at a specific time or day. Nothing in this material is (or should be considered to be) financial, investment, legal, tax or other advice and no reliance should be placed on it.
No opinion given in this material constitutes a recommendation by City Index or the author that any particular investment, security, transaction or investment strategy is suitable for any specific person. The material has not been prepared in accordance with legal requirements designed to promote the independence of investment research. Although City Index is not specifically prevented from dealing before providing this material, City Index does not seek to take advantage of the material prior to its dissemination. This material is not intended for distribution to, or use by, any person in any country or jurisdiction where such distribution or use would be contrary to local law or regulation.
For further details see our full non-independent research disclaimer and quarterly summary.
CFDs are complex instruments and come with a high risk of losing money rapidly due to leverage. 69% of retail investor accounts lose money when trading CFDs with this provider. You should consider whether you understand how CFDs work and whether you can afford to take the high risk of losing your money. CFD and Forex Trading are leveraged products and your capital is at risk. They may not be suitable for everyone. Please ensure you fully understand the risks involved by reading our full risk warning.
City Index is a trading name of StoneX Financial Ltd. Head and Registered Office: 1st Floor, Moor House, 120 London Wall, London, EC2Y 5ET. StoneX Financial Ltd is a company registered in England and Wales, number: 05616586. Authorised and regulated by the Financial Conduct Authority. FCA Register Number: 446717.
City Index is a trademark of StoneX Financial Ltd.
The information on this website is not targeted at the general public of any particular country. It is not intended for distribution to residents in any country where such distribution or use would contravene any local law or regulatory requirement.
© City Index 2024