Does Apple s share price priced bode ill for stocks
Recent price moves in Apple’s share price could be deeply important for the future direction of the world’s most-traded stock indices, and overall market volatility in the coming months.
Since peaking in July, Apple’s share price has slid some 16%, this is significant since Apple is the world’s most valuable company. Some analysts calculate that every $1 fall in Apple’s share price triggers a 0.65% decline in the S&P 500.
The decline in Apple’s share price is also symbolic, this share price has risen some 800% since the start of the uptrend back in 2009, compared to a 210% rise for the S&P 500 overall. Part of Apple’s spectacular rise has been on the back of its large share buyback policy and its decision to start paying dividends, which made its stock even more attractive to hold.
However, now that China has started to slow down, which is a major market for Apple, the tech giant may have to scale back on its buy-backs and dividends and invest its cash pile in new products to try and impress in a tougher market place compared to recent years. This could pose an even greater challenge to Apple’s share price in the coming months.
In terms of the broader market impact of Apple’s decline, further weakness may weigh on the broader market in the medium term. Since the start of this year, the S&P 500 has been reliant on a handful of companies to eke out its current 4% gain. These include: Amazon, Walt Disney, Google and, of course, Apple.
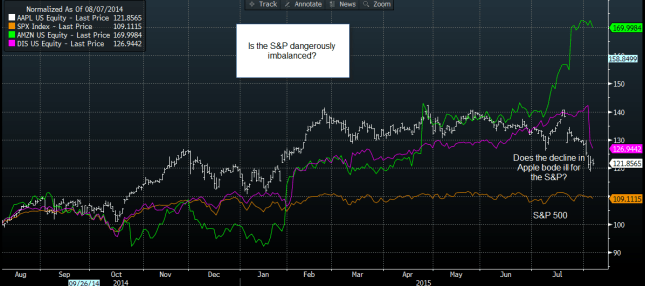
The chart below shows Apple (white line), vs. the S&P 500 (orange), it also shows the performance of Walt Disney (purple) and Amazon (green). This chart has been normalised to show how these stocks move together along with the index. As you can see, the index has underperformed Apple, Walt Disney and Amazon, although it has remained fairly stable in recent months. Now that there are signs of weakness in Apple and Walt Disney, if Google and Amazon also start to falter then it would be bad news for the overall index.
Due to the importance of the S&P 500, a sharp decline in the index on the back of a further sell off in the price of Apple could trigger a wider bout of market volatility, so watch out where the tech giant’s share price goes next.
Figure 1:
Source: City Index, Data: Bloomberg
StoneX Financial Ltd (trading as “City Index”) is an execution-only service provider. This material, whether or not it states any opinions, is for general information purposes only and it does not take into account your personal circumstances or objectives. This material has been prepared using the thoughts and opinions of the author and these may change. However, City Index does not plan to provide further updates to any material once published and it is not under any obligation to keep this material up to date. This material is short term in nature and may only relate to facts and circumstances existing at a specific time or day. Nothing in this material is (or should be considered to be) financial, investment, legal, tax or other advice and no reliance should be placed on it.
No opinion given in this material constitutes a recommendation by City Index or the author that any particular investment, security, transaction or investment strategy is suitable for any specific person. The material has not been prepared in accordance with legal requirements designed to promote the independence of investment research. Although City Index is not specifically prevented from dealing before providing this material, City Index does not seek to take advantage of the material prior to its dissemination. This material is not intended for distribution to, or use by, any person in any country or jurisdiction where such distribution or use would be contrary to local law or regulation.
For further details see our full non-independent research disclaimer and quarterly summary.
CFDs are complex instruments and come with a high risk of losing money rapidly due to leverage. 69% of retail investor accounts lose money when trading CFDs with this provider. You should consider whether you understand how CFDs work and whether you can afford to take the high risk of losing your money. CFD and Forex Trading are leveraged products and your capital is at risk. They may not be suitable for everyone. Please ensure you fully understand the risks involved by reading our full risk warning.
City Index is a trading name of StoneX Financial Ltd. Head and Registered Office: 1st Floor, Moor House, 120 London Wall, London, EC2Y 5ET. StoneX Financial Ltd is a company registered in England and Wales, number: 05616586. Authorised and regulated by the Financial Conduct Authority. FCA Register Number: 446717.
City Index is a trademark of StoneX Financial Ltd.
The information on this website is not targeted at the general public of any particular country. It is not intended for distribution to residents in any country where such distribution or use would contravene any local law or regulatory requirement.
© City Index 2024