DJIA Stock market recovery fades but was that it
Equities have surged higher this week, surprising many traders and analysts who were preparing for a stock market crash. Heavily-shorted stocks led the rally as the sellers scrambled to book profit on their positions. The resulting gains saw Wall Street log its first three-day rally of the year. Today, traders are making a more sober assessment of the situation. They know full well that bear market rallies tend to be vicious and can last from several days to several weeks. The continued rise of safe haven gold and yen suggests sentiment is still shaky and that the stock market recovery may well have been just an oversold bounce. But rallies start with short covering anyway and the fact that several key resistance levels have broken down already means the recovery may continue for a few more days yet. After all, crude oil is trying to form a long-term base, though so far the bulls have not been successful. In fact both oil contracts fell sharply this afternoon after the US Department of Energy reported a disappointing set of stockpiles data which showed stocks of oil and oil products rose across the board last week. So, the wait for a strong reversal signal continues. Nevertheless, the potential for a stronger oil price recovery is there if large oil exporters agree to freeze their production at January levels and/or US oil output starts to fall noticeably now. What’s more, the Fed’s January meeting minutes and speeches from several FOMC members suggests the Fed may delay upcoming rate hikes. Meanwhile other central banks such as the BoJ and ECB have turned even more dovish. Thus, if more central bank stimulus is introduced then this could boost the appeal of higher-yielding equities.
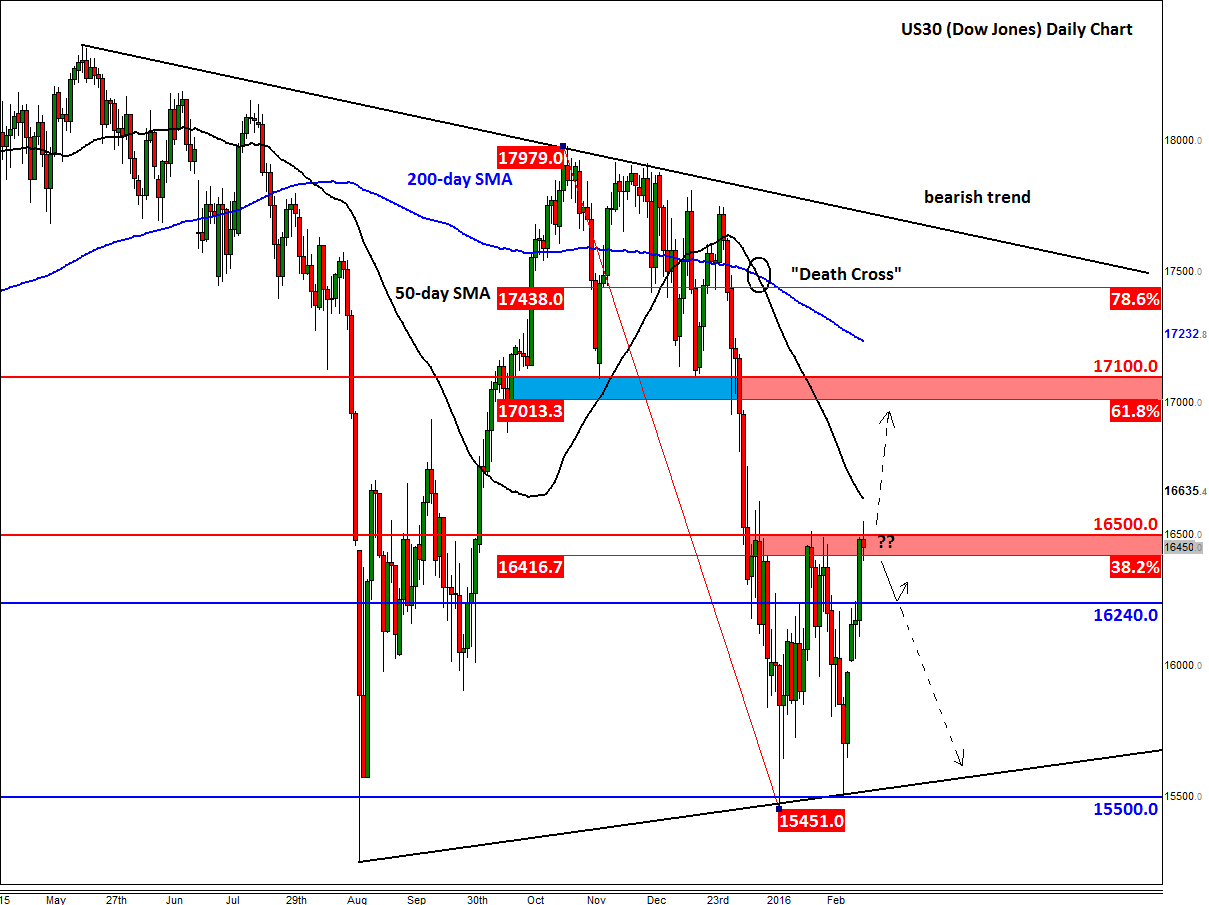
But as you can probably sense from the above paragraph, I too am very cautious whether to call this a short-covering bounce or the start of a much larger recovery. As a technical analyst and trader, I let the charts guide me in terms of near term direction, especially when I am not so sure about the fundamental outlook. Today’s price action has certainly been bearish thus far, which makes sense after a three or four day recovery in a downward trend. Some of the major indices have also reached or neared key resistance levels. The Dow for one has reached a key technical area between 16415 and 16500 today. As can be seen from the daily chart, below, this is where the 38.2% Fibonacci retracement level of the drop from the November high converges with previous resistance. Thus, what happens here could determine the direction for the next several trading days. If resistance holds here, then there is a possibility for the downward trend to resume after this week’s sharp bounce. Conversely, a clean break above this range could pave the way for a more profound recovery. Conservative speculators may therefore want to wait for the market to decide on direction and then trade in the direction of the breakout.
If the Dow manages to break above the aforementioned resistance area then there are not a lot of further hurdles to derail the potential rally (except the 50-moving average at 16635) until the 17010-17100 range. This area was previously support and corresponds with the key 61.8% Fibonacci retracement level. Of course, that’s not to say that the Dow will reach this area. It may or may not do; in any case, the 17010-17100 range merely represents a reference point where I would expect to see lots of trading activity around, should we get there.
On the other hand, if resistance holds and the Dow turns lower from this 16415-16550 range then there are not a lot of reference points to watch on the way down, apart from 16240 and round handles such as 16000 – at least not on the daily time frame, anyway. So the potential for a sharp follow-through selling pressure is there. The key long-term support resides around 15500 where we also have a rising trend line in place now. Needless to say, a potential break below this level would be a very bearish outcome as far as the long-term trends are concerned.
StoneX Financial Ltd (trading as “City Index”) is an execution-only service provider. This material, whether or not it states any opinions, is for general information purposes only and it does not take into account your personal circumstances or objectives. This material has been prepared using the thoughts and opinions of the author and these may change. However, City Index does not plan to provide further updates to any material once published and it is not under any obligation to keep this material up to date. This material is short term in nature and may only relate to facts and circumstances existing at a specific time or day. Nothing in this material is (or should be considered to be) financial, investment, legal, tax or other advice and no reliance should be placed on it.
No opinion given in this material constitutes a recommendation by City Index or the author that any particular investment, security, transaction or investment strategy is suitable for any specific person. The material has not been prepared in accordance with legal requirements designed to promote the independence of investment research. Although City Index is not specifically prevented from dealing before providing this material, City Index does not seek to take advantage of the material prior to its dissemination. This material is not intended for distribution to, or use by, any person in any country or jurisdiction where such distribution or use would be contrary to local law or regulation.
For further details see our full non-independent research disclaimer and quarterly summary.
CFDs are complex instruments and come with a high risk of losing money rapidly due to leverage. 69% of retail investor accounts lose money when trading CFDs with this provider. You should consider whether you understand how CFDs work and whether you can afford to take the high risk of losing your money. CFD and Forex Trading are leveraged products and your capital is at risk. They may not be suitable for everyone. Please ensure you fully understand the risks involved by reading our full risk warning.
City Index is a trading name of StoneX Financial Ltd. Head and Registered Office: 1st Floor, Moor House, 120 London Wall, London, EC2Y 5ET. StoneX Financial Ltd is a company registered in England and Wales, number: 05616586. Authorised and regulated by the Financial Conduct Authority. FCA Register Number: 446717.
City Index is a trademark of StoneX Financial Ltd.
The information on this website is not targeted at the general public of any particular country. It is not intended for distribution to residents in any country where such distribution or use would contravene any local law or regulatory requirement.
© City Index 2024