DAX European stocks stage oversold bounce
After a nightmare start in the first week of 2016, and despite another 5% drop in Chinese shares overnight, European stock markets have finally staged a much-needed bounce from oversold levels this morning. Sentiment has improved a tad on no apparent news, although China’s continued attempts to shore up confidence there could be among the reasons for this so-far small bounce. The US fourth quarter earnings season, which kicks into a higher gear with a couple of major banks reporting their results later in the week, may provide some support. Aluminium producer Alcoa will unofficially mark the start of the reporting season with its results after the closing bell tonight.
Hopefully it is going to be a quieter week this week, though that didn’t stop the South African rand to take a massive hit overnight, dropping some 10 per cent to fall to a record low. It has since bounced back though and we have seen similar rebounds across many financial markets. But it is too early to say if the worst is now behind us; let’s wait and see how the markets will close today. There was a kind of similar price action on Friday only for stocks to tumble in the last hour of trading in the US. Indeed, Chinese concerns could intensify this week if, for example, Wednesday’s trade figures point to further slowdown in the world’s second largest economy.
But one thing is for sure and China aside, it is going to be a quieter week in terms of economic data compared to last week when we had several global macro pointers including the monthly US jobs report, which was surprisingly strong. However despite the 292 thousand job gains, there was no wage growth in December and that really disappointed the dollar bulls. One other reason why the dollar index fell was because of the rally in the EUR/USD, which behaved like a funding currency pair again last week. The likes of the GBP/USD, NZD/USD and AUD/USD all fell, so the dollar’s selling wasn’t broad-based.
Today, the EUR/USD is edging back lower inside a consolidation pattern as stock markets try to stabilize. The euro hasn’t been helped by news that Eurozone investor confidence (Sentix) fell ‘surprisingly’ sharply to 9.6 in January from 15.7 in December when a drop to 11.5 was expected. But given the magnitude of the stock market sell-off, this looks hardly surprising to me.
Meanwhile, the GBP/USD has bounced strongly from oversold levels and after the sellers were unable to push it below the psychological level of 1.45 overnight. The EURGBP is therefore falling, and the FX cross was back below the key 0.7480-7500 area at the time of this writing. Was that a false breakout, then? Time will tell.
If the equity markets manage to stage a decent recovery from these levels then the EUR/USD may fall back below the key 1.08 and resume it long-term downward trend. The opposite is obviously also true. But although it is too early, there may be reason to be a bit more optimistic on stocks given that the major indices are testing and so far holding above significant support levels. This week we will therefore either see a nice bounce back from these oversold and technically-important levels, of simply break below them, leading to further big drops.
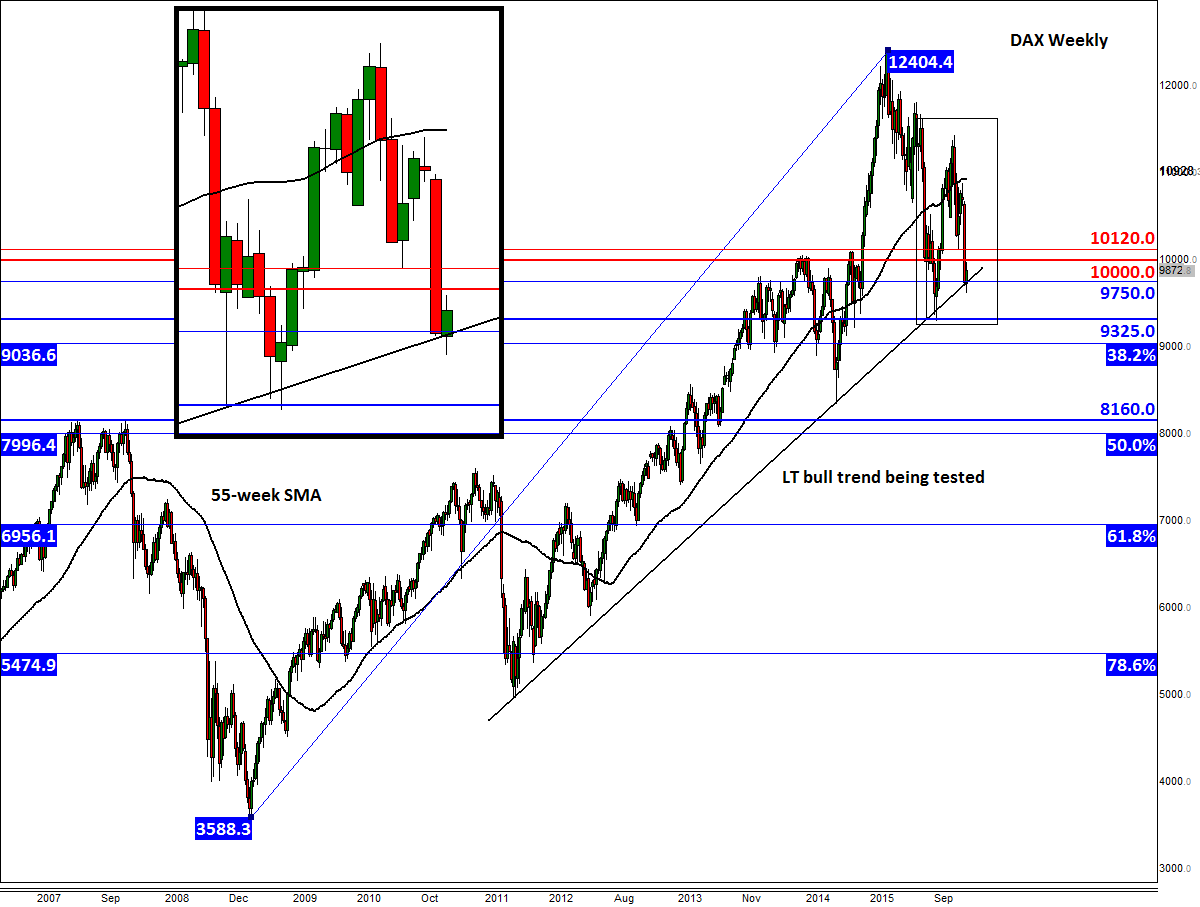
Take the weekly chart of the DAX as an example, below. As can be seen, the German benchmark index is currently testing a bullish trend line that goes back all the way to September 2011, around 9750 (or thereabouts). A positive daily close here would bode well for the rest of the week, while a decisive break down could see the index go for a test of the August 2015 low around 9325 then the 38.2% Fibonacci retracement of the multi-year rally at 9035. Some of the potential resistance levels to watch on this time frame are the psychologically-important 10,000 handle and then previous key support around 10120.
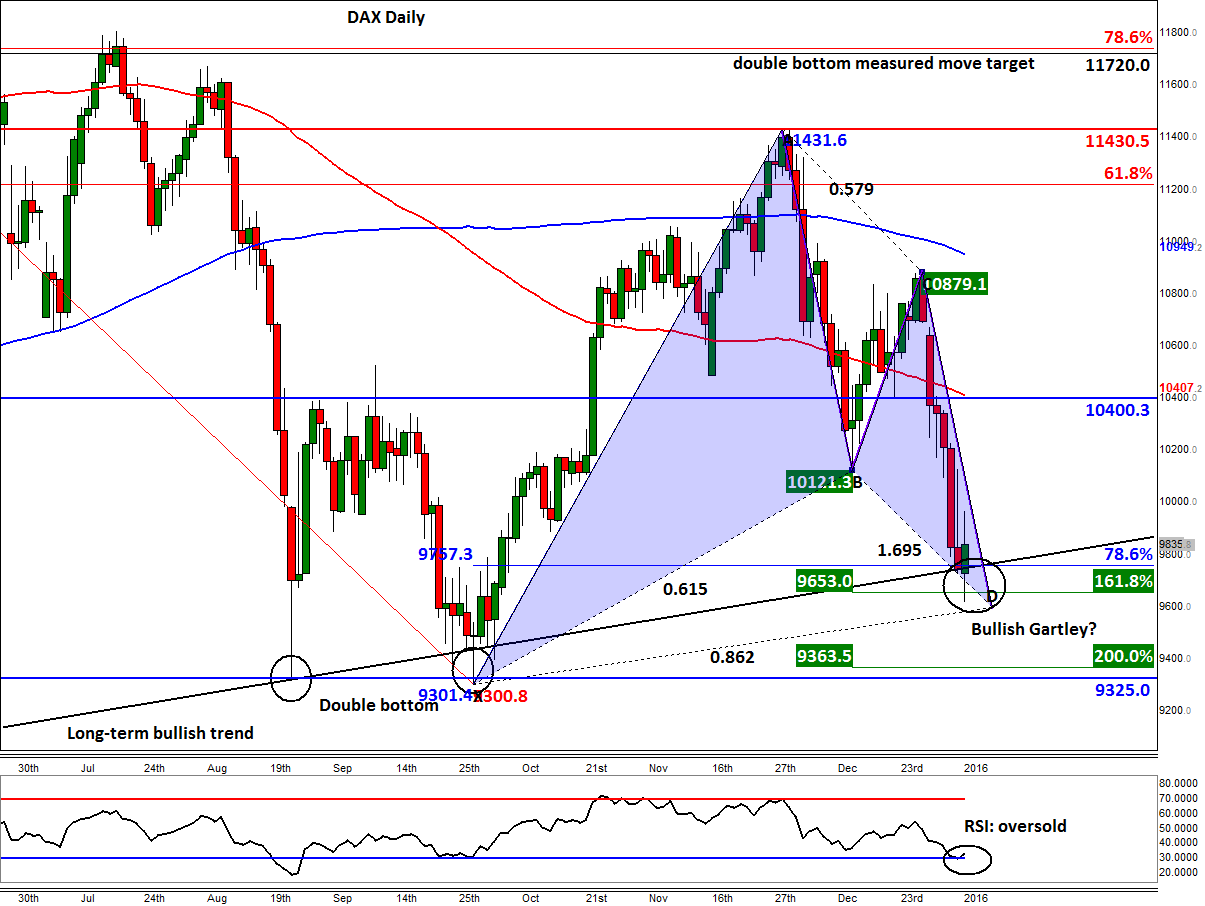
Meanwhile on the daily time frame (figure 2), there is a bullish Gartley pattern in the making around the long-term trend line. This harmonic price pattern is derived by combining a couple of Fibonacci levels with point D of an AB=CD move. These patterns are rare but when they present themselves as neatly as in this example, one should ignore them at their peril. Given the convergence of the Gartley and the long-term bullish trend line here today’s bounce back should not come as a major surprise. But will we see a more significant rally here? If the rally fails to materialise at this critically-important support area then traders should interpret this as a significant bearish indication. The failure of a bounce could disappoint more potential buyers, leading to significant drops in the days and weeks to come. So, proceed with caution, as always.
StoneX Financial Ltd (trading as “City Index”) is an execution-only service provider. This material, whether or not it states any opinions, is for general information purposes only and it does not take into account your personal circumstances or objectives. This material has been prepared using the thoughts and opinions of the author and these may change. However, City Index does not plan to provide further updates to any material once published and it is not under any obligation to keep this material up to date. This material is short term in nature and may only relate to facts and circumstances existing at a specific time or day. Nothing in this material is (or should be considered to be) financial, investment, legal, tax or other advice and no reliance should be placed on it.
No opinion given in this material constitutes a recommendation by City Index or the author that any particular investment, security, transaction or investment strategy is suitable for any specific person. The material has not been prepared in accordance with legal requirements designed to promote the independence of investment research. Although City Index is not specifically prevented from dealing before providing this material, City Index does not seek to take advantage of the material prior to its dissemination. This material is not intended for distribution to, or use by, any person in any country or jurisdiction where such distribution or use would be contrary to local law or regulation.
For further details see our full non-independent research disclaimer and quarterly summary.
CFDs are complex instruments and come with a high risk of losing money rapidly due to leverage. 69% of retail investor accounts lose money when trading CFDs with this provider. You should consider whether you understand how CFDs work and whether you can afford to take the high risk of losing your money. CFD and Forex Trading are leveraged products and your capital is at risk. They may not be suitable for everyone. Please ensure you fully understand the risks involved by reading our full risk warning.
City Index is a trading name of StoneX Financial Ltd. Head and Registered Office: 1st Floor, Moor House, 120 London Wall, London, EC2Y 5ET. StoneX Financial Ltd is a company registered in England and Wales, number: 05616586. Authorised and regulated by the Financial Conduct Authority. FCA Register Number: 446717.
City Index is a trademark of StoneX Financial Ltd.
The information on this website is not targeted at the general public of any particular country. It is not intended for distribution to residents in any country where such distribution or use would contravene any local law or regulatory requirement.
© City Index 2024