Daily FX Technical Trend Bias Key Levels Tues 23 Apr
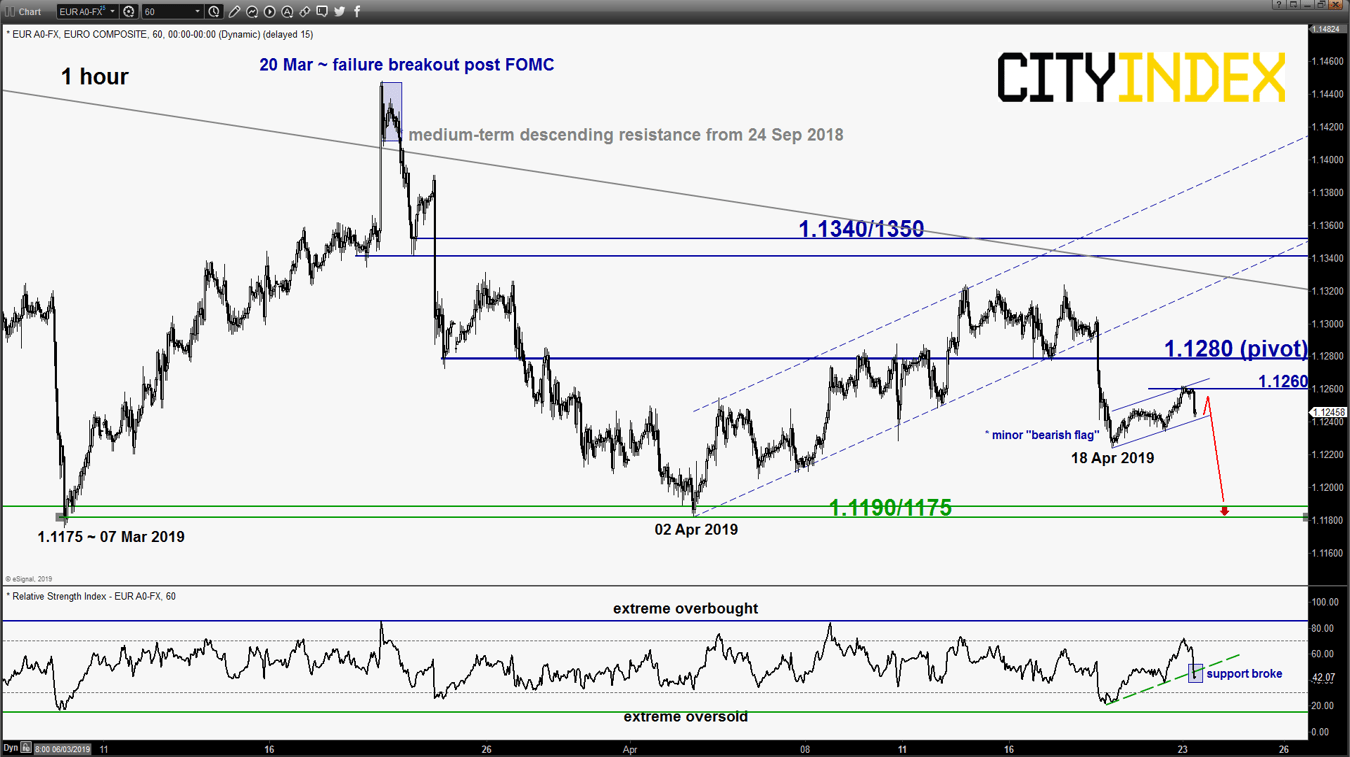
EUR/USD – Push down to retest key medium-term support
click to enlarge chart
- Last Thurs 18 Apr, the pair broke below the 1.1280 short-term pivotal support that invalidated the residual push up scenario as per highlighted in our previous report (click here for a recap).
- Short-term elements have turned bearish where the pair is now evolving within a minor “bearish flag” range consolidation since its 18 Apr 2019 low of 1.1224 to retrace its previous swift push down from 18 Apr 2009 high of 1.1304. In addition, the hourly RSI oscillator has staged a bearish down from a corresponding support at the 45 level (ahead of the parallel price action support of the minor “bearish flag”)
- Flip to a bearish bias in any bounces below the 1.1280 key short-term pivotal resistance for a further potential push down to retest the medium-term range support of 1.1190/1175. However, a clearance above 1.1280 negates the bearish tone for a squeeze up towards 1.1340/1350 (medium-term descending resistance from 24 Sep 2018 high & 61.8% Fibonacci retracement of the previous slide from 20 Mar 2019 high to 02 Apr 2019 low).
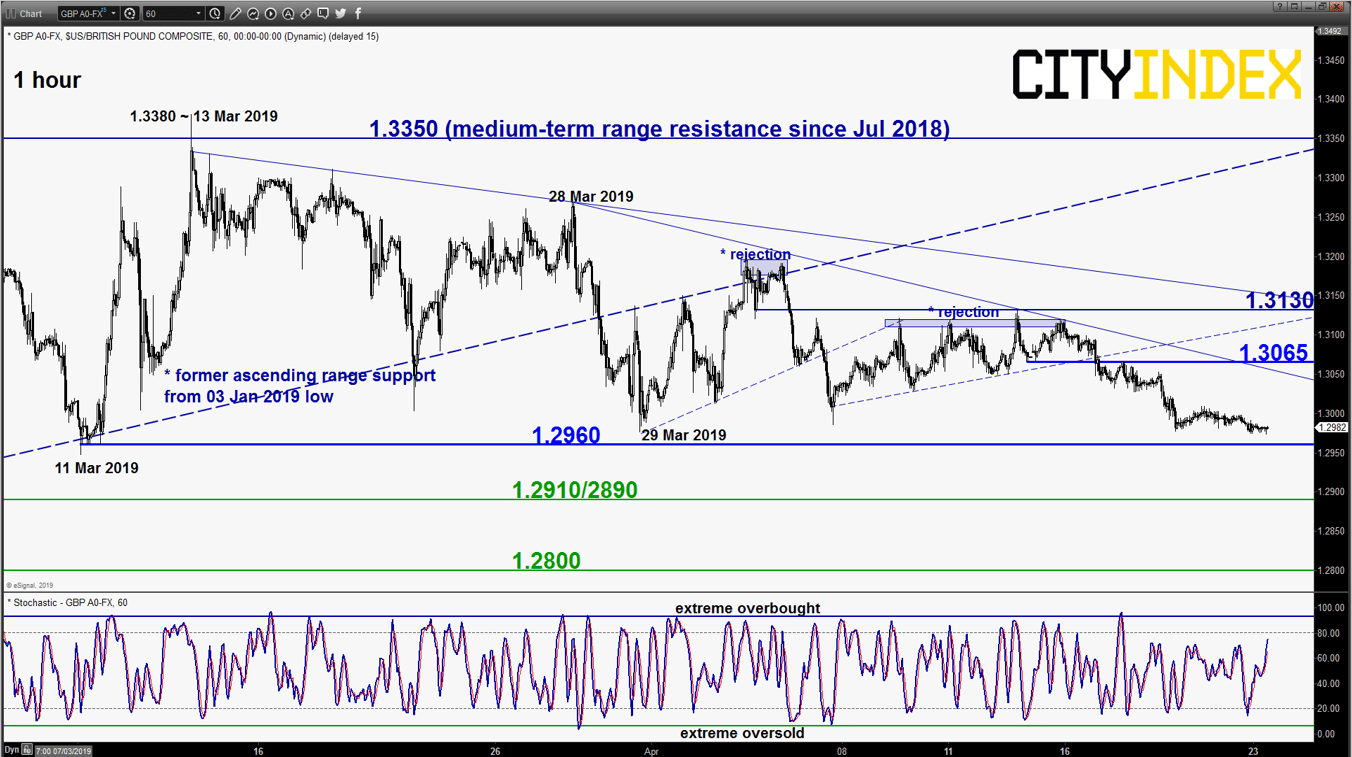
GBP/USD – Mix elements, watch 1.2960 range support
click to enlarge chart
- Drifted down lower as expected and hit the minor range support/target of 1.2980/2960 as per highlighted in our previous report. Mix elements now, prefer to turn neutral between 1.2960 and 1.3065 (minor descending resistance from 28 Mar 2019 high & 61.8% Fibonacci retracement of the latest push down seen from 12 Apr high to 23 Apr current intraday Asian session low of 1.2975). An hourly close below 1.2960 opens up scope for a further slide to target the next near-term supports at 1.2910/2890 follow by 1.2800 (14 Feb 2019 swing low & 61.8% Fibonacci retracement of the up move from 03 Jan 2019 low to 13 Mar 2019 high).
- On the flipside, a break above 1.3065 sees a squeeze up to retest the next intermediate resistance at 1.3130.
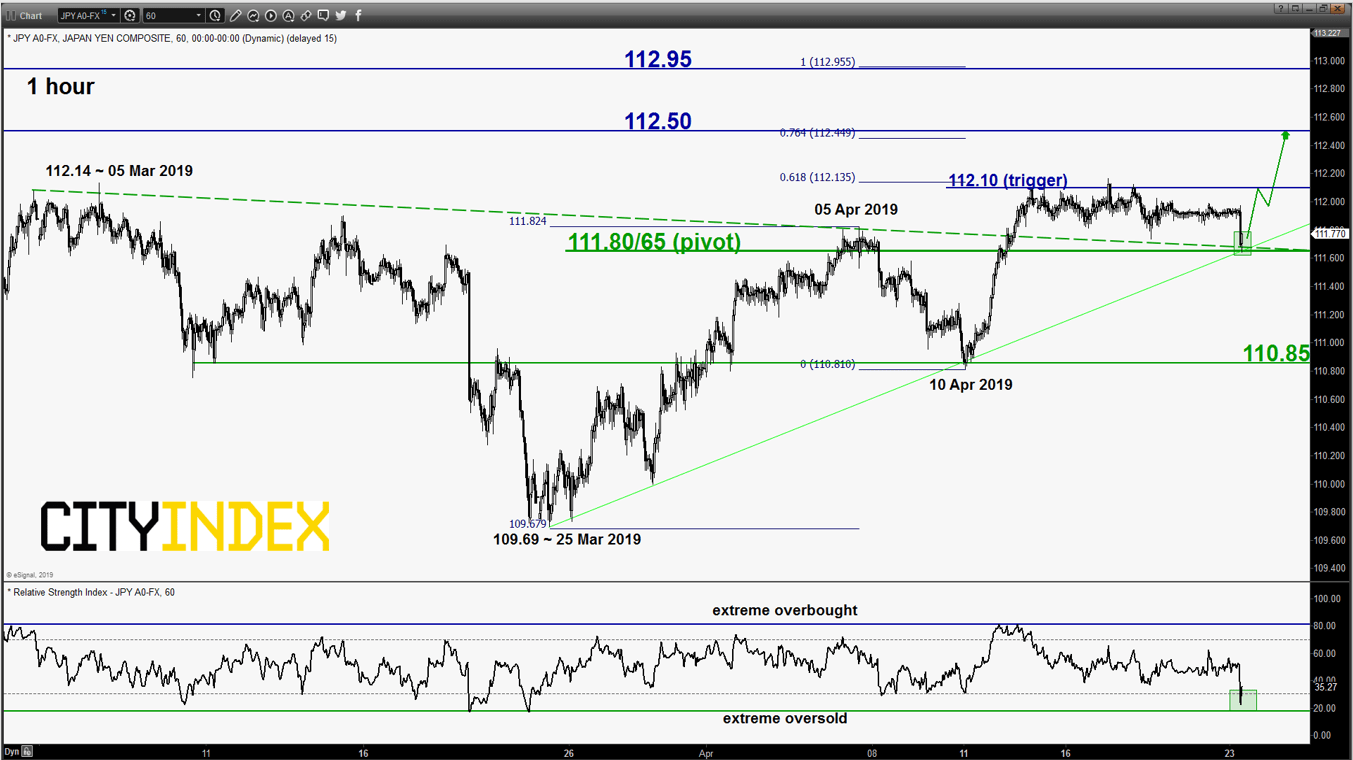
USD/JPY – Tolerate excess to 111.65 for a further potential push up
click to enlarge chart
- Pierced below the 111.80 key short-term pivotal support as per highlighted in our previous report and hit a 5-day low of 111.65 in today, Asian session before it rebounded back towards 111.80 amid the on-going U.S/Iran tensions. Interestingly, the rebound has occurred right at the intersection area of the minor ascending trendline support from 25 Mar 2019 low and the pull-back support of the former descending resistance from 05 Mar 2019. In addition, the hourly RSI oscillator has exited from its oversold region.
- Tolerate the excess and maintain the bullish bias above 111.80/65 key short-term pivotal support and a break above 112.10 reinforces a further potential push up to target the next intermediate resistances at 112.50.
- However, an hourly close below 111.65 negates the bullish tone for another round of slide to retest the 110.85 support.
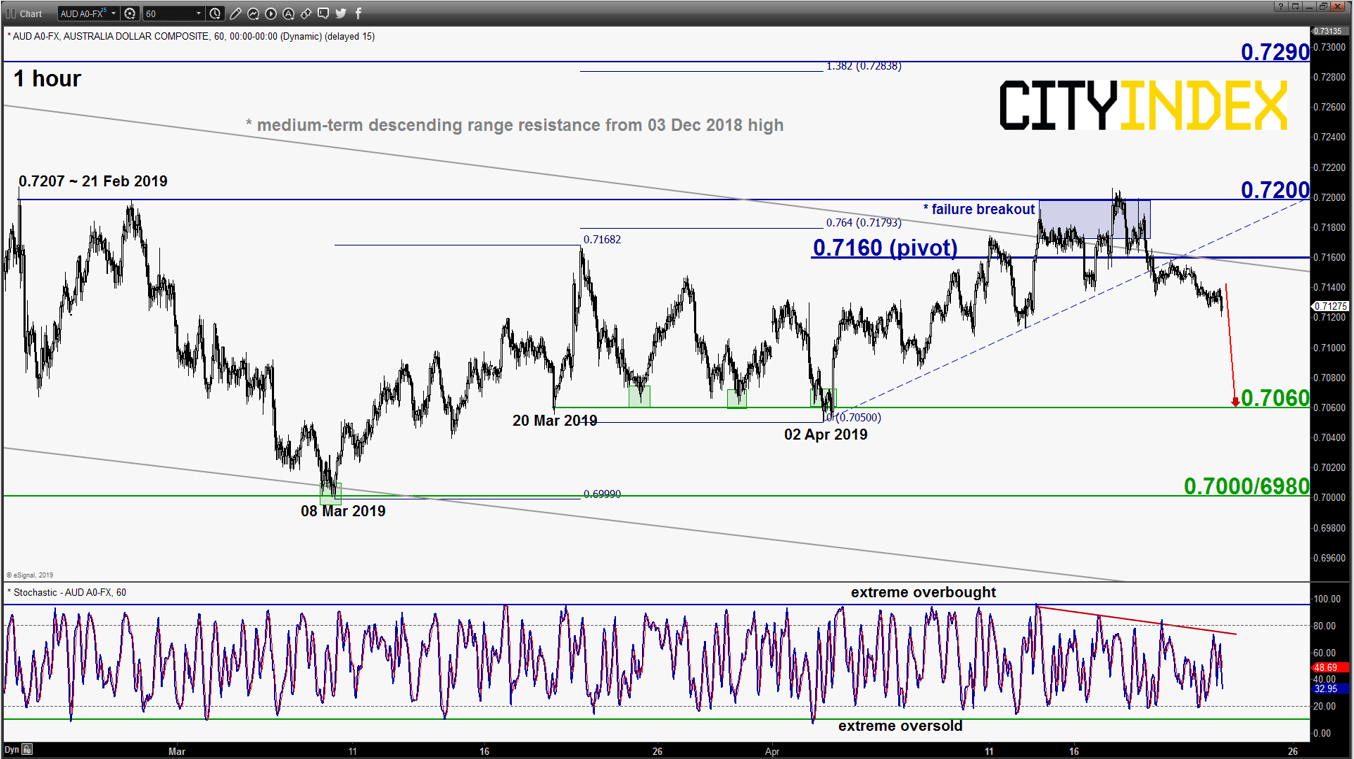
AUD/USD – Further push down within range
click to enlarge chart
- Broke below the 0.7145 lower limit of the short-term neutrality zone as per highlighted in our previous report on last Thurs, 18 Apr that reinstated the push down within range scenario. Flip back to a bearish bias below 0.7160 key short-term pivotal resistance (also the medium-term descending range resistance from 03 Dec 2018 high) for a further potential push down to retest the 0.7060 minor range support in place since 20 Mar 2019.
- However, a break above 0.7160 negates the bearish tone for squeeze up towards 0.7200.
Charts are from eSignal
StoneX Financial Ltd (trading as “City Index”) is an execution-only service provider. This material, whether or not it states any opinions, is for general information purposes only and it does not take into account your personal circumstances or objectives. This material has been prepared using the thoughts and opinions of the author and these may change. However, City Index does not plan to provide further updates to any material once published and it is not under any obligation to keep this material up to date. This material is short term in nature and may only relate to facts and circumstances existing at a specific time or day. Nothing in this material is (or should be considered to be) financial, investment, legal, tax or other advice and no reliance should be placed on it.
No opinion given in this material constitutes a recommendation by City Index or the author that any particular investment, security, transaction or investment strategy is suitable for any specific person. The material has not been prepared in accordance with legal requirements designed to promote the independence of investment research. Although City Index is not specifically prevented from dealing before providing this material, City Index does not seek to take advantage of the material prior to its dissemination. This material is not intended for distribution to, or use by, any person in any country or jurisdiction where such distribution or use would be contrary to local law or regulation.
For further details see our full non-independent research disclaimer and quarterly summary.
CFDs are complex instruments and come with a high risk of losing money rapidly due to leverage. 69% of retail investor accounts lose money when trading CFDs with this provider. You should consider whether you understand how CFDs work and whether you can afford to take the high risk of losing your money. CFD and Forex Trading are leveraged products and your capital is at risk. They may not be suitable for everyone. Please ensure you fully understand the risks involved by reading our full risk warning.
City Index is a trading name of StoneX Financial Ltd. Head and Registered Office: 1st Floor, Moor House, 120 London Wall, London, EC2Y 5ET. StoneX Financial Ltd is a company registered in England and Wales, number: 05616586. Authorised and regulated by the Financial Conduct Authority. FCA Register Number: 446717.
City Index is a trademark of StoneX Financial Ltd.
The information on this website is not targeted at the general public of any particular country. It is not intended for distribution to residents in any country where such distribution or use would contravene any local law or regulatory requirement.
© City Index 2024