Daily FX Technical Trend Bias Key Levels Tues 21 May
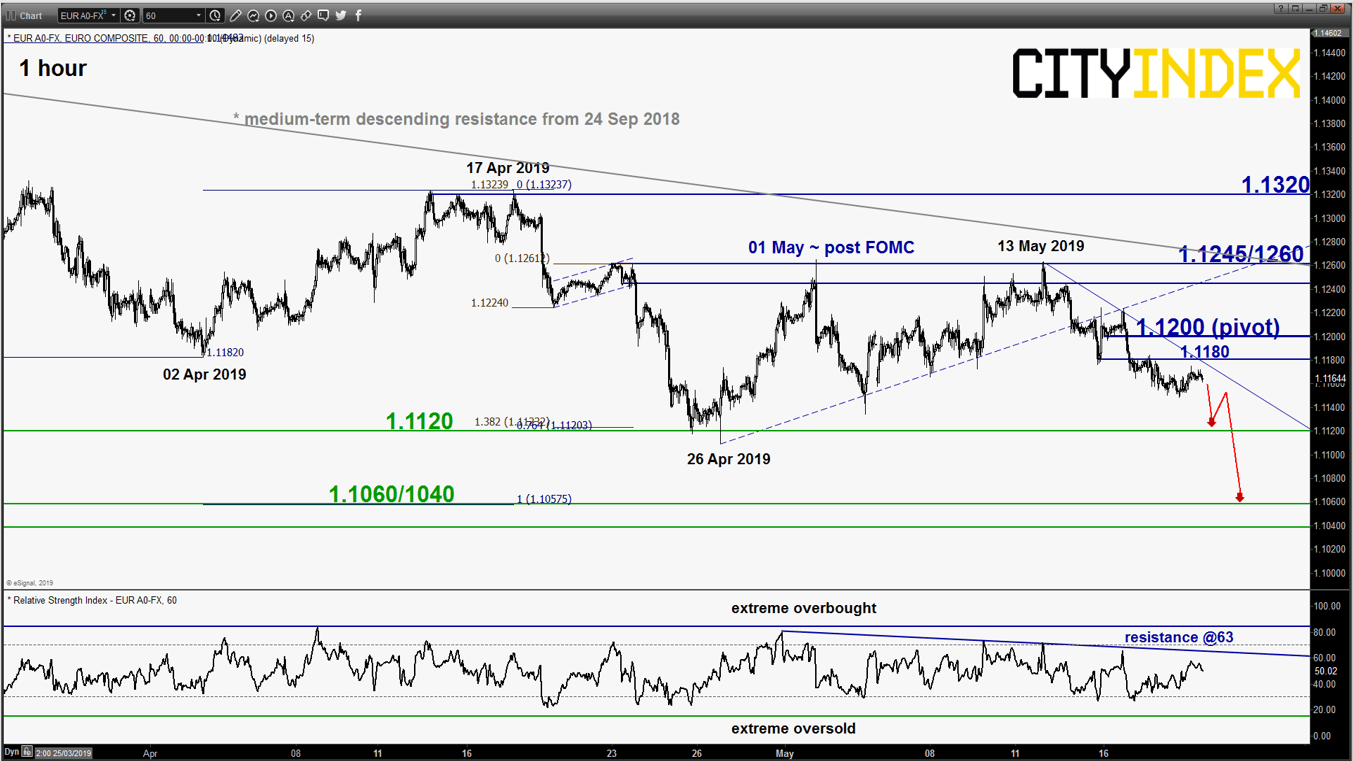
EUR/USD – Further potential slide in progress
click to enlarge chart
- Continued to drift lower as expected (click here for a recap on our previous report). Short-term elements remain negative, maintain bearish bias below tightened key short-term pivotal resistance at 1.1200 for a push down to retest 1.1120 and a break below it opens up scope for a further potential decline to target the next near-term support at 1.1060/1040 (Fibonacci retracement/expansion cluster).
- On the other hand, a break with an hourly close above 1.1200 negates the bearish tone for a corrective bounce towards 1.1245/1260 (range resistance in place since the recent FOMC meeting held on 01 May).
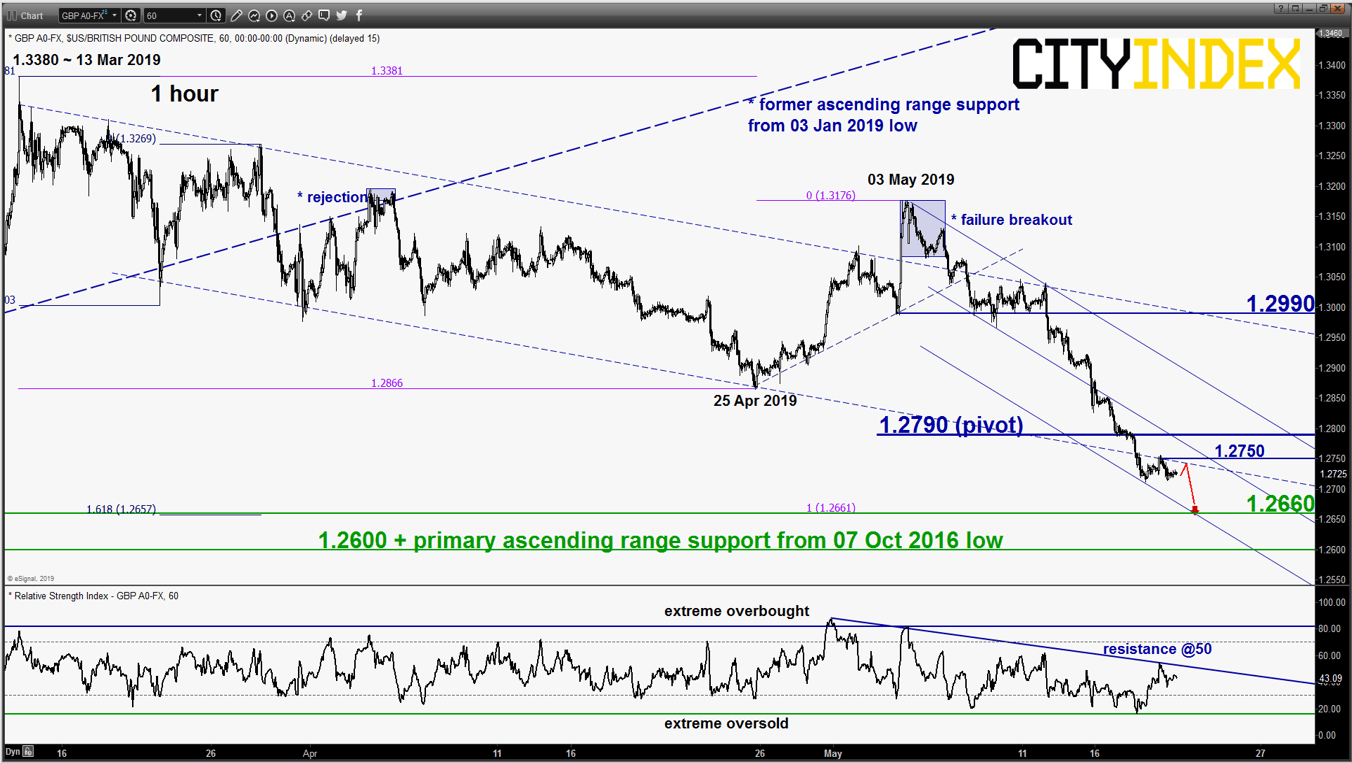
GBP/USD – Further potential slide towards major support
click to enlarge chart
- The pair has broken below the 1.2750 lower limit of the short-term neutrality zone as per highlighted in our previous report on the backdrop of a fresh “Brexit crisis” resurgence. Flip back to a bearish bias with 1.2790 as the key short-term pivotal resistance for a further potential push down to target 1.2660 (also the 76.4% Fibonacci retracement of the previous multi-month up move from 03 Jan 2019 low to 13 Mar 2019 high) with a maximum limit set at 1.2600 (also the primary ascending range support in place since 07 Oct 2016 low).
- On the other hand, a break with an hour close above 1.2790 sees a squeeze up towards the 1.2990 intermediate resistance (former minor swing low areas of 03/10 May 2019 & the upper boundary of the descending channel from 13 Mar 2019 high)
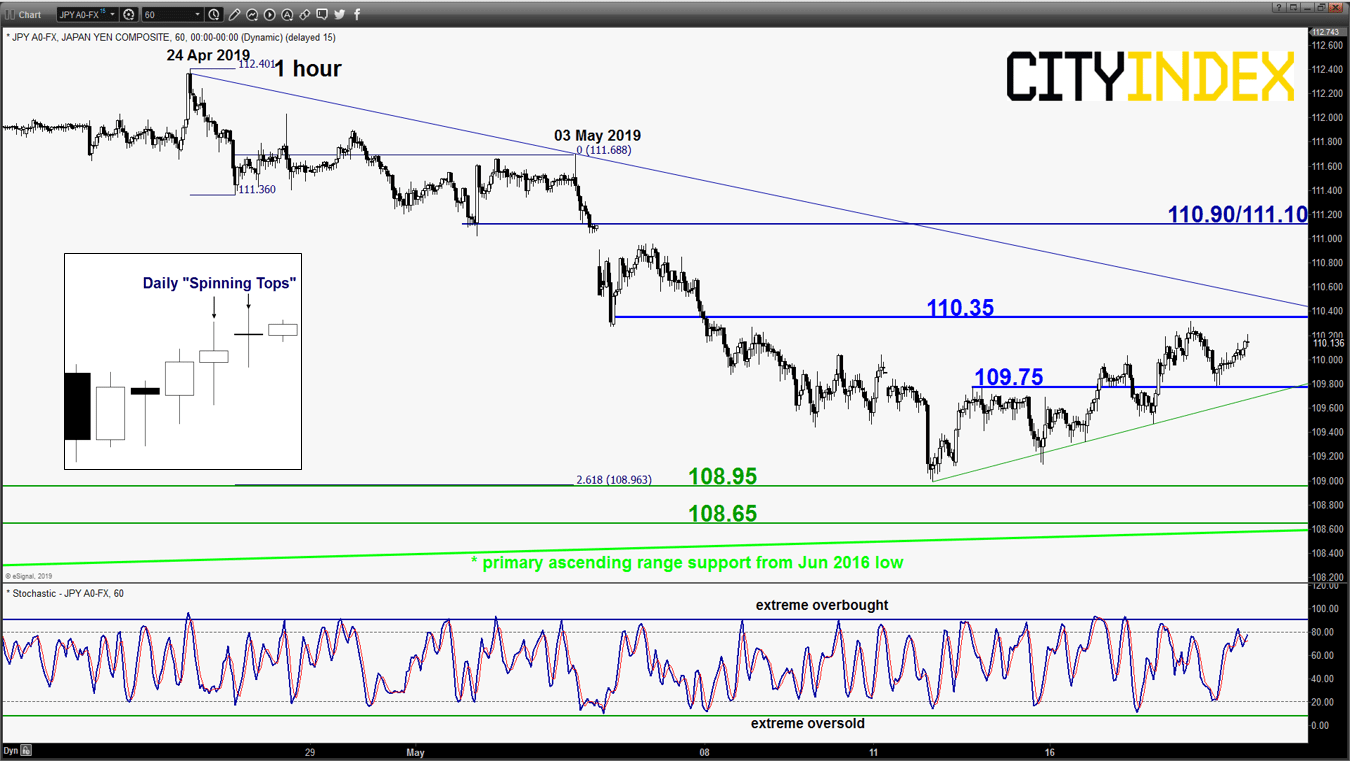
USD/JPY – Mix elements, watch 110.35 and 109.75
click to enlarge chart
- Inched higher above the 110.05 short-term pivotal resistance that has negated the preferred bearish scenario as per highlighted in our previous report. Despite the higher price actions seen in the last two sessions, the pair has ended yesterday, 20 May U.S. session with a second consecutive daily “Spinning Top” candlestick pattern which suggests indecisiveness by the current bulls to push prices higher.
- Mix elements, prefer to turn neutral now between 110.35 and 109.75 (also the minor ascending support from 13 May 2019 low. Only an hourly close below 109.75 reignites the bears for a potential push down to target 108.95 and the 108.65 major support (also the primary ascending range support from Jun 2016 low).
- On the flipside, a clearance above 110.35 sees a further corrective rebound sequence towards the key medium-term resistance zone of 110.90/111.10 (also the pull-back resistance of the former ascending support from 03 Jan 2019 low).
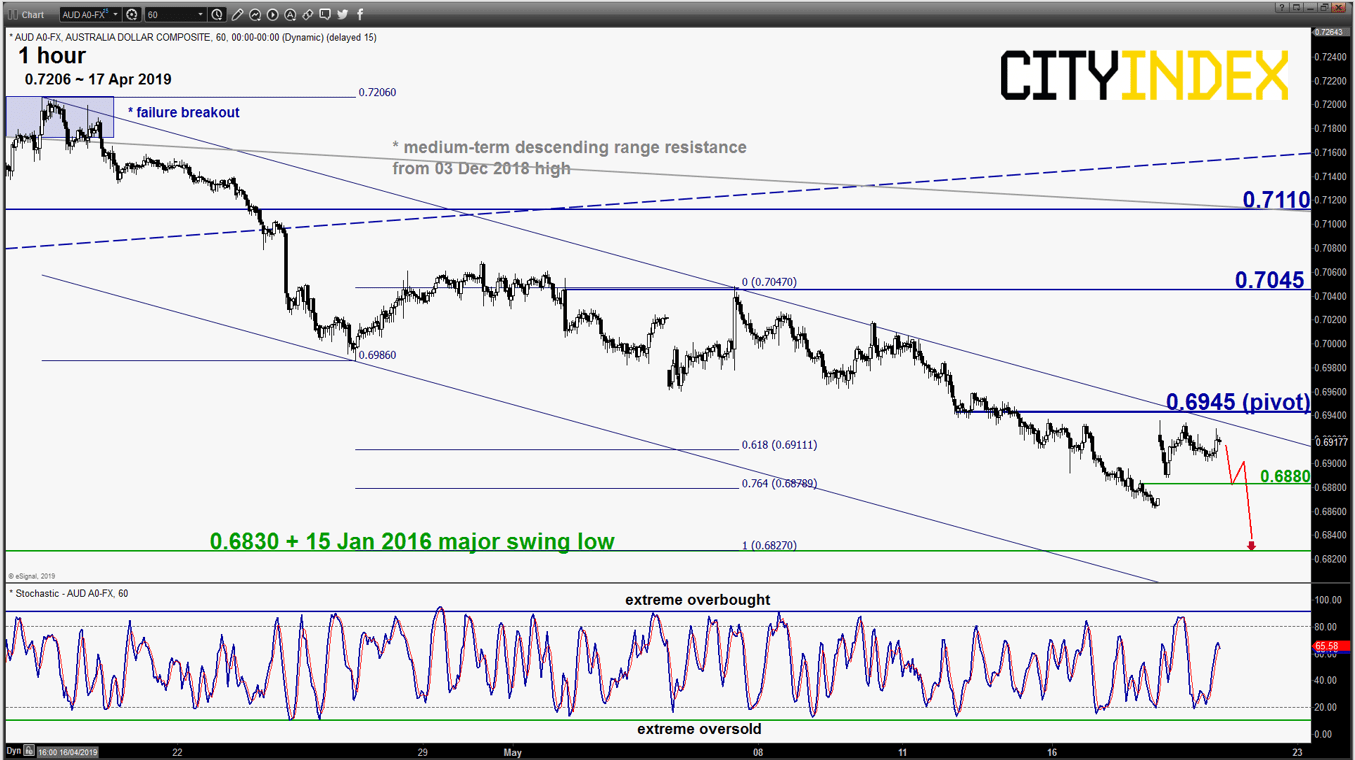
AUD/USD – 0.6945 remains the key resistance to watch
click to enlarge chart
- The AUD/USD gapped up by 70 pips yesterday, 20 May after the results of the AU election where current incumber PM Scott Morrison and his party had retained power in AU parliament. Prior to the election results, the pair had inched lower as expected to print a 3-month low of 0.6865 as seen in last Fri, 17 May U.S. session.
- The post-election rally has fizzled right below the 0.6945 key short-term pivotal resistance as per highlighted in our previous report (also the upper boundary of a descending channel from 17 Apr 2019 high). Thus, maintain bearish bias with 0.6880 as the downside trigger (gap support formed post-election) and a break below it reinforces the potential push down to target the significant support at 0.6830 before risk of a corrective rebound occurs.
- On the other hand, a break with an hourly close above 0.6945 invalidates the bearish scenario to kickstart the corrective rebound sequence towards the next intermediate resistance at 0.7045 (formed after the recent RBA meeting on 07 May)
Charts are from eSignal
StoneX Financial Ltd (trading as “City Index”) is an execution-only service provider. This material, whether or not it states any opinions, is for general information purposes only and it does not take into account your personal circumstances or objectives. This material has been prepared using the thoughts and opinions of the author and these may change. However, City Index does not plan to provide further updates to any material once published and it is not under any obligation to keep this material up to date. This material is short term in nature and may only relate to facts and circumstances existing at a specific time or day. Nothing in this material is (or should be considered to be) financial, investment, legal, tax or other advice and no reliance should be placed on it.
No opinion given in this material constitutes a recommendation by City Index or the author that any particular investment, security, transaction or investment strategy is suitable for any specific person. The material has not been prepared in accordance with legal requirements designed to promote the independence of investment research. Although City Index is not specifically prevented from dealing before providing this material, City Index does not seek to take advantage of the material prior to its dissemination. This material is not intended for distribution to, or use by, any person in any country or jurisdiction where such distribution or use would be contrary to local law or regulation.
For further details see our full non-independent research disclaimer and quarterly summary.
CFDs are complex instruments and come with a high risk of losing money rapidly due to leverage. 69% of retail investor accounts lose money when trading CFDs with this provider. You should consider whether you understand how CFDs work and whether you can afford to take the high risk of losing your money. CFD and Forex Trading are leveraged products and your capital is at risk. They may not be suitable for everyone. Please ensure you fully understand the risks involved by reading our full risk warning.
City Index is a trading name of StoneX Financial Ltd. Head and Registered Office: 1st Floor, Moor House, 120 London Wall, London, EC2Y 5ET. StoneX Financial Ltd is a company registered in England and Wales, number: 05616586. Authorised and regulated by the Financial Conduct Authority. FCA Register Number: 446717.
City Index is a trademark of StoneX Financial Ltd.
The information on this website is not targeted at the general public of any particular country. It is not intended for distribution to residents in any country where such distribution or use would contravene any local law or regulatory requirement.
© City Index 2024