Daily FX Technical Trend Bias Key Levels Thurs 16 May
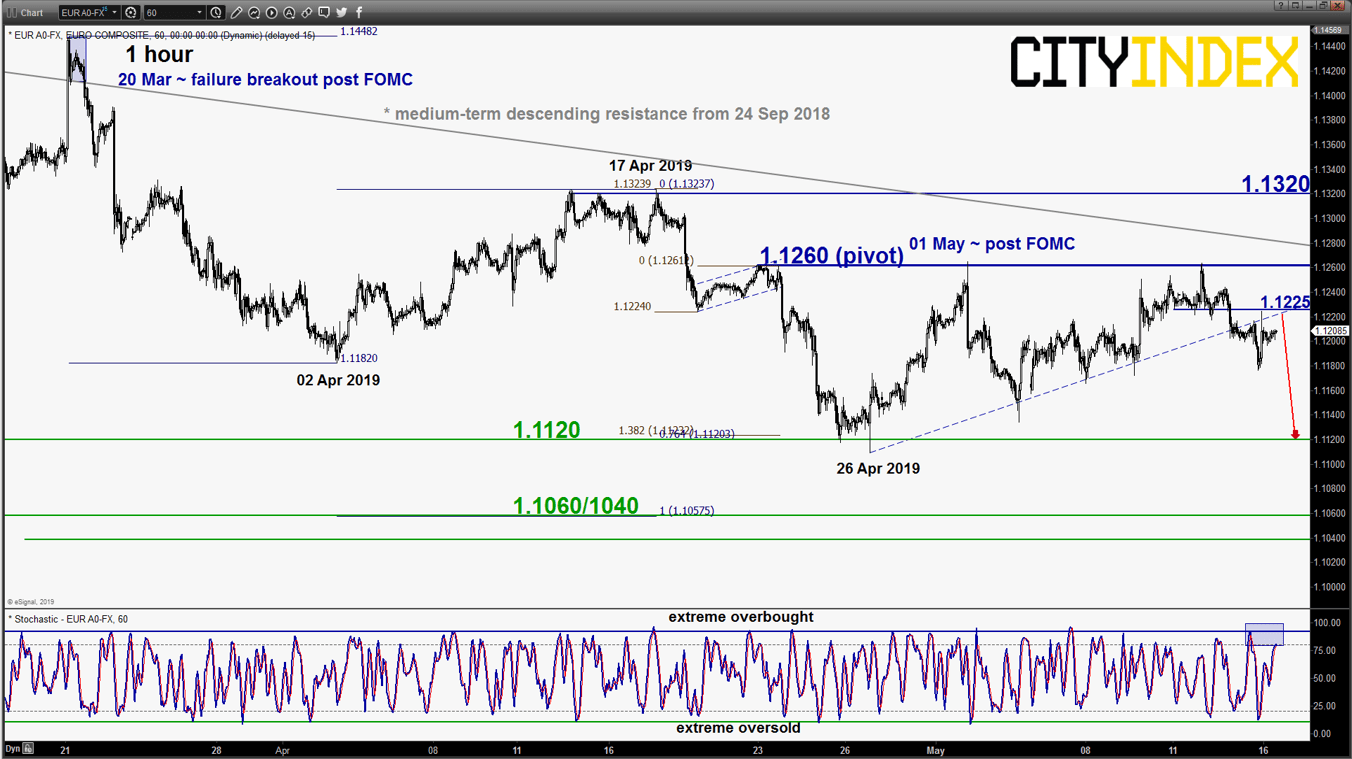
EUR/USD – Further potential push down in progress
click to enlarge chart
- No major changes on its short-term elements, the bounce from yesterday’s European session low of 1.1176 had stalled at the pull-back resistance of the former minor ascending support from 26 Apr 2019 low at 1.1225. Maintain bearish bias with 1.1260 remains as the key short-term pivotal resistance for another round of potential slide to retest 1.1120 in the first step.
- On the other hand, an hourly close above 1.1260 invalidates the bearish scenario for a further corrective push up towards the 1.1320 key medium-term resistance.
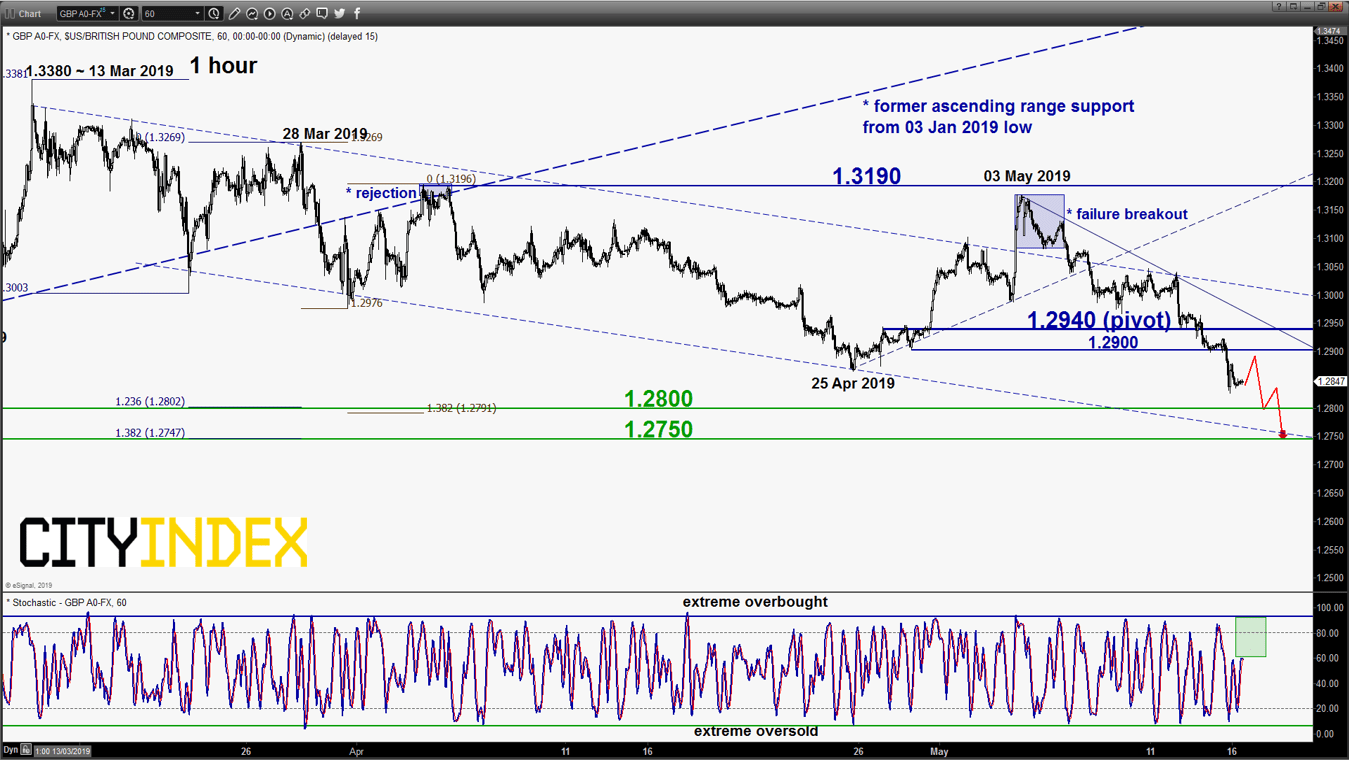
GBP/USD – Potential residual push down in progress
click to enlarge chart
- Drifted down lower as expected and breached below the first target/support at 1.2870 as per highlighted in our previous report (click here for a recap). Maintain bearish bias and do expect a minor bounce first as the hourly Stochastic oscillator has inched upwards from its oversold region and still has not reached an extreme overbought level. Tightened the key short-term pivotal resistance to 1.2940 (also the minor descending trendline from 03 May 2019 high) for another round of potential push down to target the 1.2800 follow by 1.2750 next before risk of consolidation sets in.
- On the other hand, an hourly close above 1.2940 invalidates the residual push down scenario to kickstart another corrective rebound sequence towards next intermediate resistance at 1.3190.
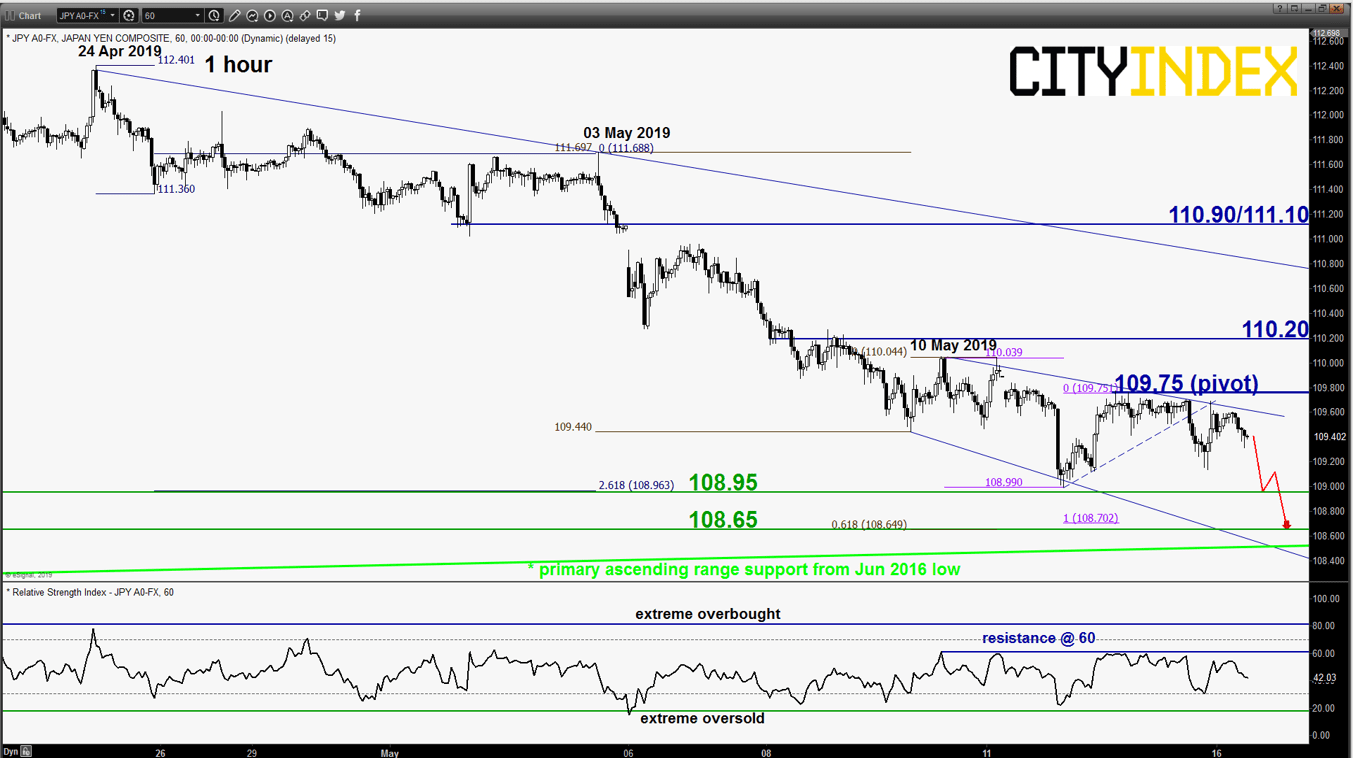
USD/JPY – 109.75 is key resistance to watch
click to enlarge chart
- The rebound from yesterday’s U.S. session low of 109.13 had stalled right below 109.75; the upper limit of the short-term neutrality zone as per highlighted in our previous report. Interestingly, its price action has started to evolve into a minor “Expanding Wedge” configuration since 10 May 2019 that indicates a further potential push down sequence at this juncture.
- Flip back to a bearish bias with 109.75 as the key short-term pivotal resistance for a further potential push down to target 108.95 and 108.65 major support (also the primary ascending range support from Jun 2016 low). On the other hand, an hourly close above 109.75 opens up scope for a corrective rebound sequence towards 110.20 (minor swing high area of 08 May 2019 & Fibonacci retracement/expansion cluster)
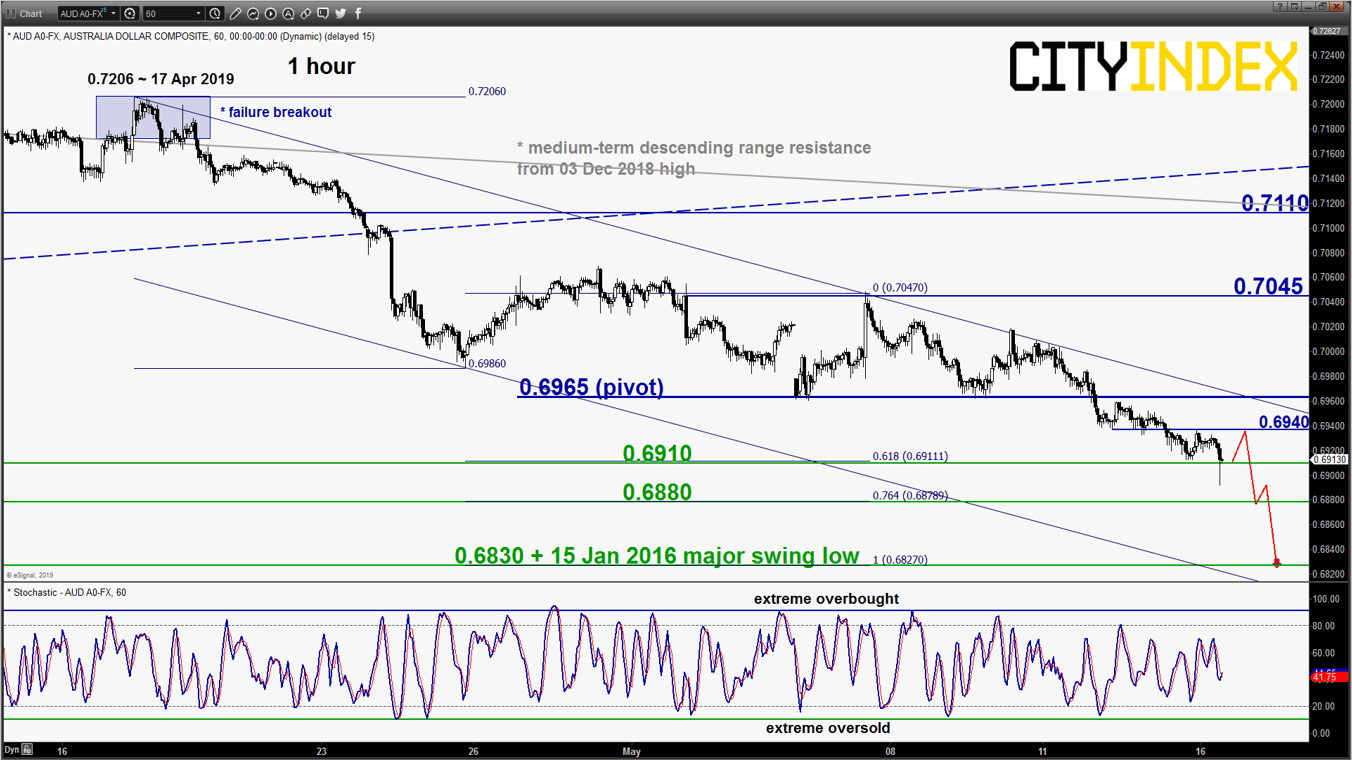
AUD/USD – No clear signs of bearish exhaustion
click to enlarge chart
- Continued to drop lower as expected and met the first target/support of 0.6910 in today’s Asian session after the release of AU jobs data for April where it reflected a mix picture with the unemployment rate inched up slightly higher to 5.2% (above consensus of 5.1%) while the participation rate inched up slightly higher to 65.8% (above consensus of 65.7%).
- No clear signs of bearish exhaustion yet. Maintain bearish bias with 0.6965 remains as the key short-term pivotal resistance for another round of potential drop to target 0.6880 next and a break below it exposes the major support at 0.6830 (the lower boundary of the minor descending channel in place since 17 Apr 2019 high, Fibonacci expansion & 15 Jan 2016 swing low area).
- On the other hand, an hourly close above 0.6990 negates the bearish tone for a squeeze up towards the 0.7045 range resistance formed after the recent RBA meeting on 07 May.
Charts are from eSignal
StoneX Financial Ltd (trading as “City Index”) is an execution-only service provider. This material, whether or not it states any opinions, is for general information purposes only and it does not take into account your personal circumstances or objectives. This material has been prepared using the thoughts and opinions of the author and these may change. However, City Index does not plan to provide further updates to any material once published and it is not under any obligation to keep this material up to date. This material is short term in nature and may only relate to facts and circumstances existing at a specific time or day. Nothing in this material is (or should be considered to be) financial, investment, legal, tax or other advice and no reliance should be placed on it.
No opinion given in this material constitutes a recommendation by City Index or the author that any particular investment, security, transaction or investment strategy is suitable for any specific person. The material has not been prepared in accordance with legal requirements designed to promote the independence of investment research. Although City Index is not specifically prevented from dealing before providing this material, City Index does not seek to take advantage of the material prior to its dissemination. This material is not intended for distribution to, or use by, any person in any country or jurisdiction where such distribution or use would be contrary to local law or regulation.
For further details see our full non-independent research disclaimer and quarterly summary.
CFDs are complex instruments and come with a high risk of losing money rapidly due to leverage. 69% of retail investor accounts lose money when trading CFDs with this provider. You should consider whether you understand how CFDs work and whether you can afford to take the high risk of losing your money. CFD and Forex Trading are leveraged products and your capital is at risk. They may not be suitable for everyone. Please ensure you fully understand the risks involved by reading our full risk warning.
City Index is a trading name of StoneX Financial Ltd. Head and Registered Office: 1st Floor, Moor House, 120 London Wall, London, EC2Y 5ET. StoneX Financial Ltd is a company registered in England and Wales, number: 05616586. Authorised and regulated by the Financial Conduct Authority. FCA Register Number: 446717.
City Index is a trademark of StoneX Financial Ltd.
The information on this website is not targeted at the general public of any particular country. It is not intended for distribution to residents in any country where such distribution or use would contravene any local law or regulatory requirement.
© City Index 2024