Daily FX Technical Trend Bias Key Levels Thurs 09 May
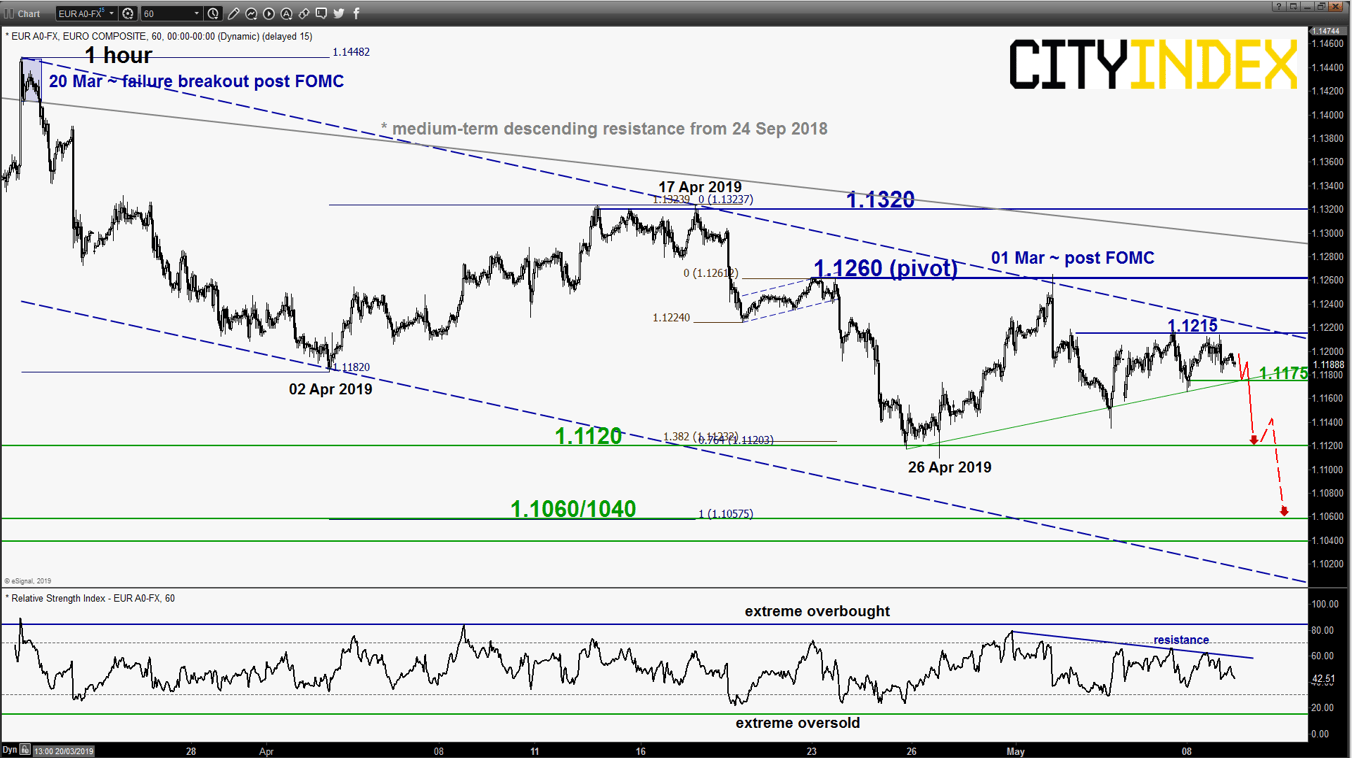
EUR/USD – Due for a potential volatility breakout
click to enlarge chart
- Continued to trade in a tight range of 30 to 50 pips since Mon, 06 May below the 1.1215 intermediate resistance (click here for a recap on our previous report). Maintain bearish bias below 1.1260 key short-term pivotal resistance and a break below 1.1175 (minor ascending support from 26 Apr 2019 low) is likely to trigger the start of another potential impulsive downleg to retest 1.1120 before targeting 1.1060/1040 next.
- On the other hand, an hourly close above 1.1260 invalidates the bearish scenario for a further corrective push up towards the key 1.1320 medium-term resistance.
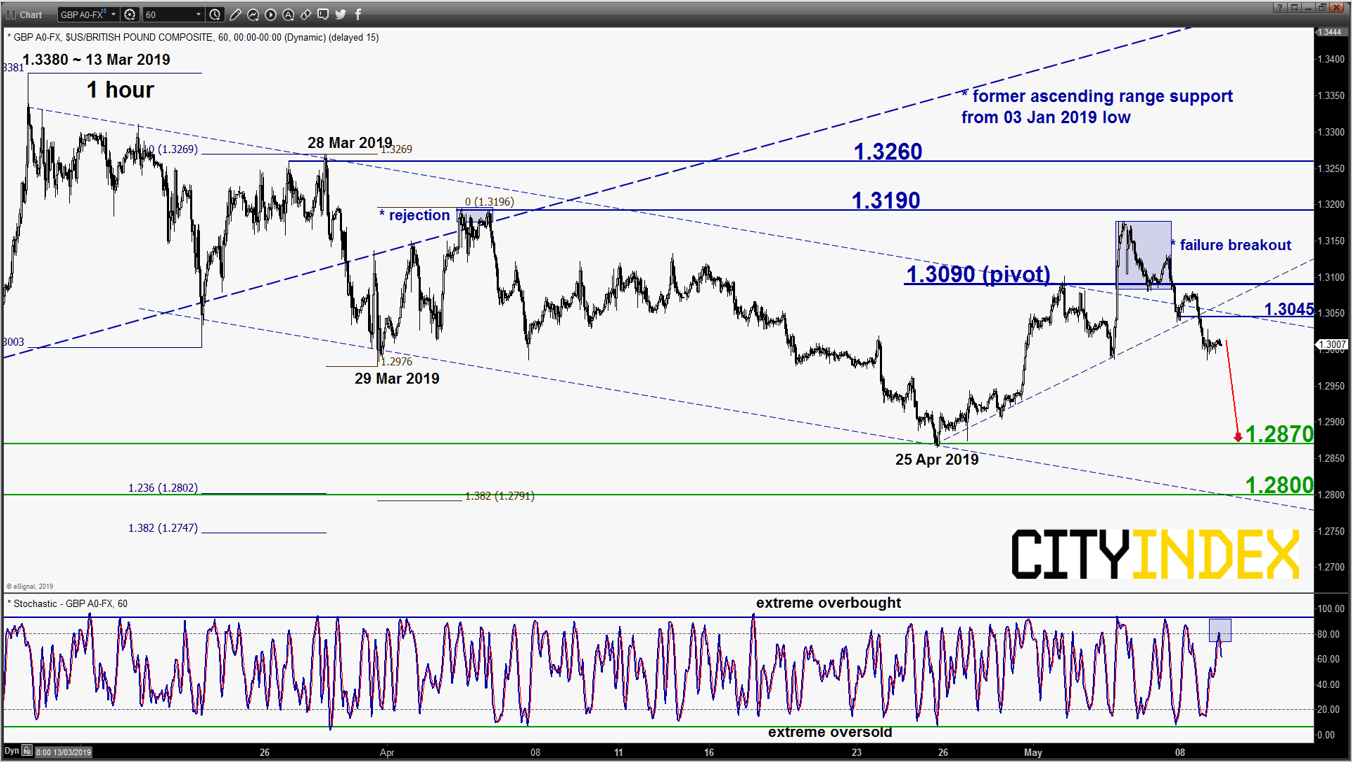
GBP/USD – Failure bullish breakout, further potential decline within range
click to enlarge chart
- Broke below the 1.3040 key short-term pivotal support and reintegrated back below the descending channel resistance from 13 Mar 2019 swing high which indicated that the bullish breakout seen on last Fri, 03 May was a failure.
- Flip back to a bearish bias in any bounces below 1.3090 key short-term pivotal resistance (50% Fibonacci retracement of on-going slide from 03 May 2019 high & former minor swing low of 06 May 2019) for a further potential push down to retest the 25 Apr 2019 low of 1.2870 follow by 1.2800 next (lower boundary of the descending channel & Fibonacci retracement/expansion cluster).
- On the other hand, an hourly close above 1.3090 invalidates the bearish tone for a squeeze up towards the next intermediate resistance at 1.3190.
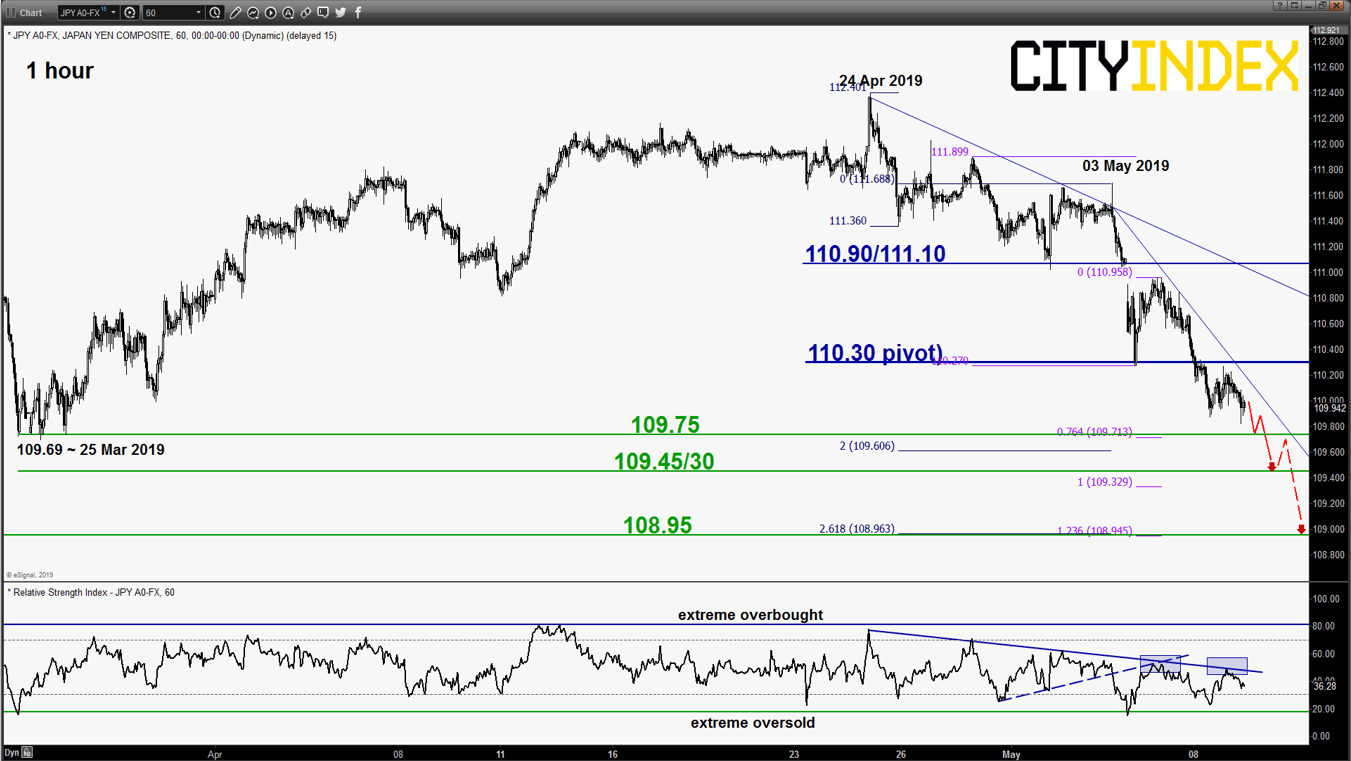
USD/JPY – Further drop in progress
click to enlarge chart
- Drifted down lower as expected and it now hovering right above the first support/target of 109.75 (25 Mar 2019 swing low area). No clear signs of bearish exhaustion, maintain bearish bias below a tightened key short-term resistance now at 110.30 (minor descending trendline from 03 May 2019 high & former minor swing low of 06 May 2019) for a further potential push down to target 109.45/30 follow by 108.95 next (Fibonacci expansion cluster & 31 Jan 2019 swing low area)
- On the other hand, an hourly close above 110.30 negates the bearish tone up towards the next intermediate resistance at 110.90/111.10 (06 May 2019 gapped down & pull-back resistance of the former ascending support from 03 Jan 2019 flash crash swing low area).
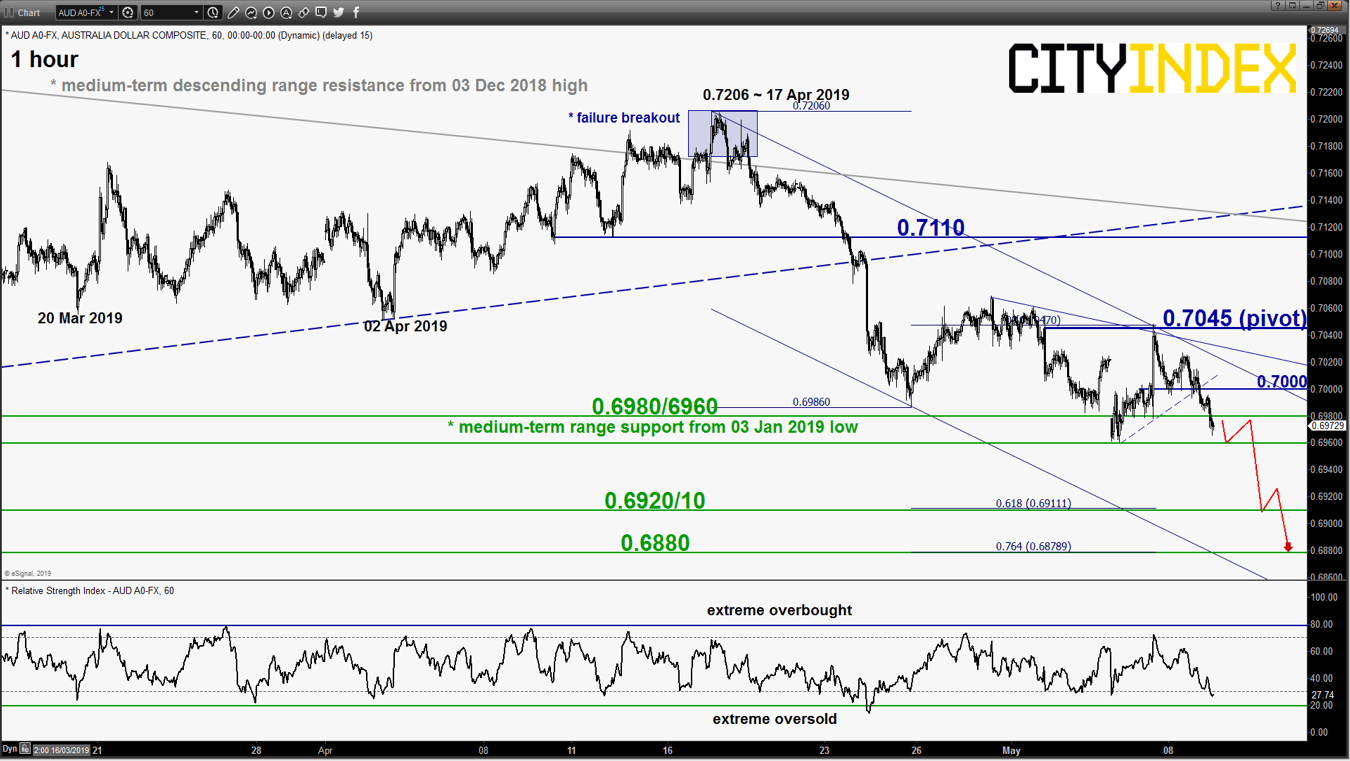
AUD/USD – At risk of a bearish breakdown
click to enlarge chart
- Broke below the 0.6995 lower limit of the short-term/minor neutrality range as per highlighted in our previous report which titled the odds back to the bears for a potential bearish breakdown. Flip back to a bearish bias in any bounces below 0.7045 key short-term pivotal resistance and a 4-hour close below 0.6960 reinforces a bearish breakdown below its medium-term range support to target the next near-term support at 0.6920/10 follow by 0.6880 next.
- On the other hand, an hourly close above 0.7045 invalidates the bearish tone for a squeeze up to retest the 0.7110 key medium-term resistance.
Charts are from eSignal
StoneX Financial Ltd (trading as “City Index”) is an execution-only service provider. This material, whether or not it states any opinions, is for general information purposes only and it does not take into account your personal circumstances or objectives. This material has been prepared using the thoughts and opinions of the author and these may change. However, City Index does not plan to provide further updates to any material once published and it is not under any obligation to keep this material up to date. This material is short term in nature and may only relate to facts and circumstances existing at a specific time or day. Nothing in this material is (or should be considered to be) financial, investment, legal, tax or other advice and no reliance should be placed on it.
No opinion given in this material constitutes a recommendation by City Index or the author that any particular investment, security, transaction or investment strategy is suitable for any specific person. The material has not been prepared in accordance with legal requirements designed to promote the independence of investment research. Although City Index is not specifically prevented from dealing before providing this material, City Index does not seek to take advantage of the material prior to its dissemination. This material is not intended for distribution to, or use by, any person in any country or jurisdiction where such distribution or use would be contrary to local law or regulation.
For further details see our full non-independent research disclaimer and quarterly summary.
CFDs are complex instruments and come with a high risk of losing money rapidly due to leverage. 69% of retail investor accounts lose money when trading CFDs with this provider. You should consider whether you understand how CFDs work and whether you can afford to take the high risk of losing your money. CFD and Forex Trading are leveraged products and your capital is at risk. They may not be suitable for everyone. Please ensure you fully understand the risks involved by reading our full risk warning.
City Index is a trading name of StoneX Financial Ltd. Head and Registered Office: 1st Floor, Moor House, 120 London Wall, London, EC2Y 5ET. StoneX Financial Ltd is a company registered in England and Wales, number: 05616586. Authorised and regulated by the Financial Conduct Authority. FCA Register Number: 446717.
City Index is a trademark of StoneX Financial Ltd.
The information on this website is not targeted at the general public of any particular country. It is not intended for distribution to residents in any country where such distribution or use would contravene any local law or regulatory requirement.
© City Index 2024