Daily FX Technical Trend Bias Key Levels Mon 13 May
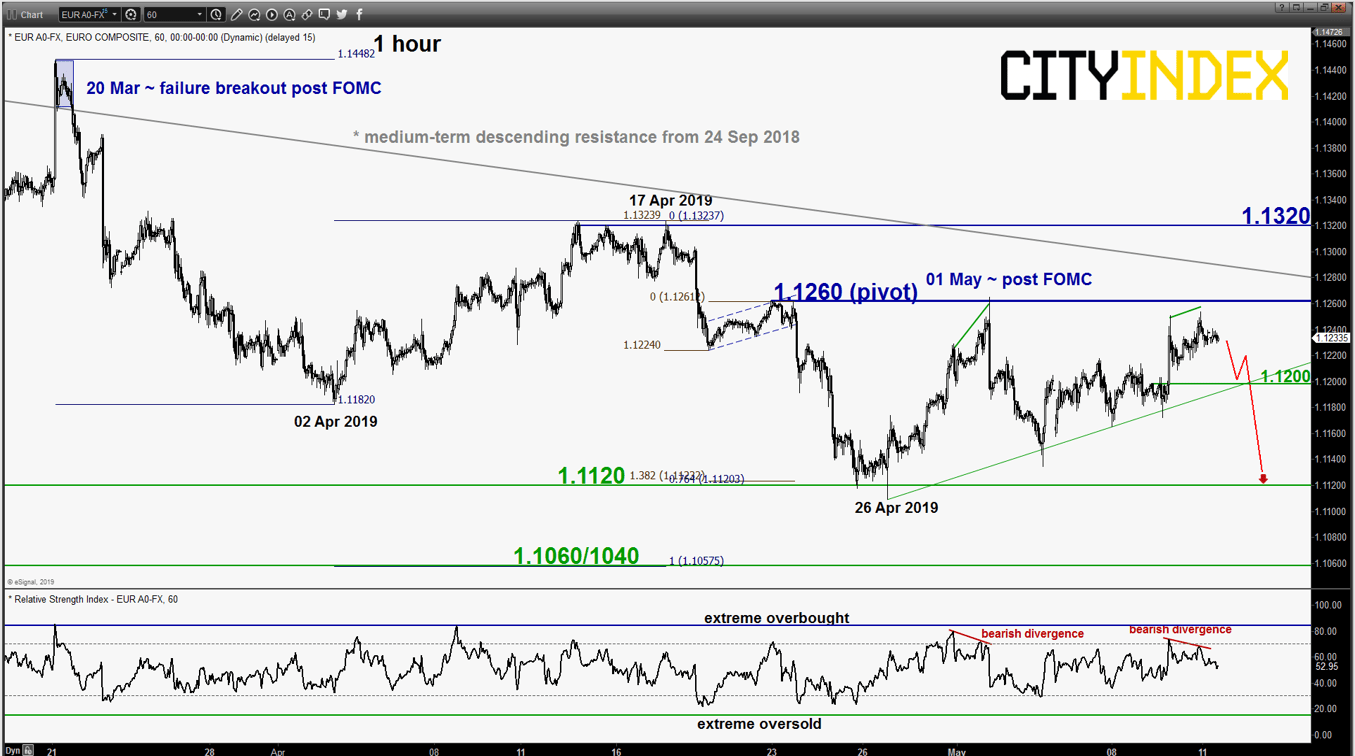
EUR/USD – 1.1260 remains the key resistance to watch
click to enlarge chart
- Inched higher but remained below the 1.1260 key short-term pivotal resistance as per highlighted in our previous report (click here for a recap). Short-term momentum has started to turn negative as the hourly RSI oscillator has flashed a bearish divergence signal at its overbought region last Fri, 10 May. Interestingly, similar observation on the hourly RSI has been detected on 30 Apr/01 May; post FOMC which the price action shaped a slide of 130 pips thereafter.
- Maintain bearish bias with 1.1260 remains as the key short-term pivotal resistance and a break below 1.1200 (minor ascending support from 263 Apr 2019 low) reinforces a potential slide to retest 1.1120 in the first step. However, an hourly close above 1.1260 invalidates the bearish scenario for a further corrective push up towards the key 1.1320 medium-term resistance.
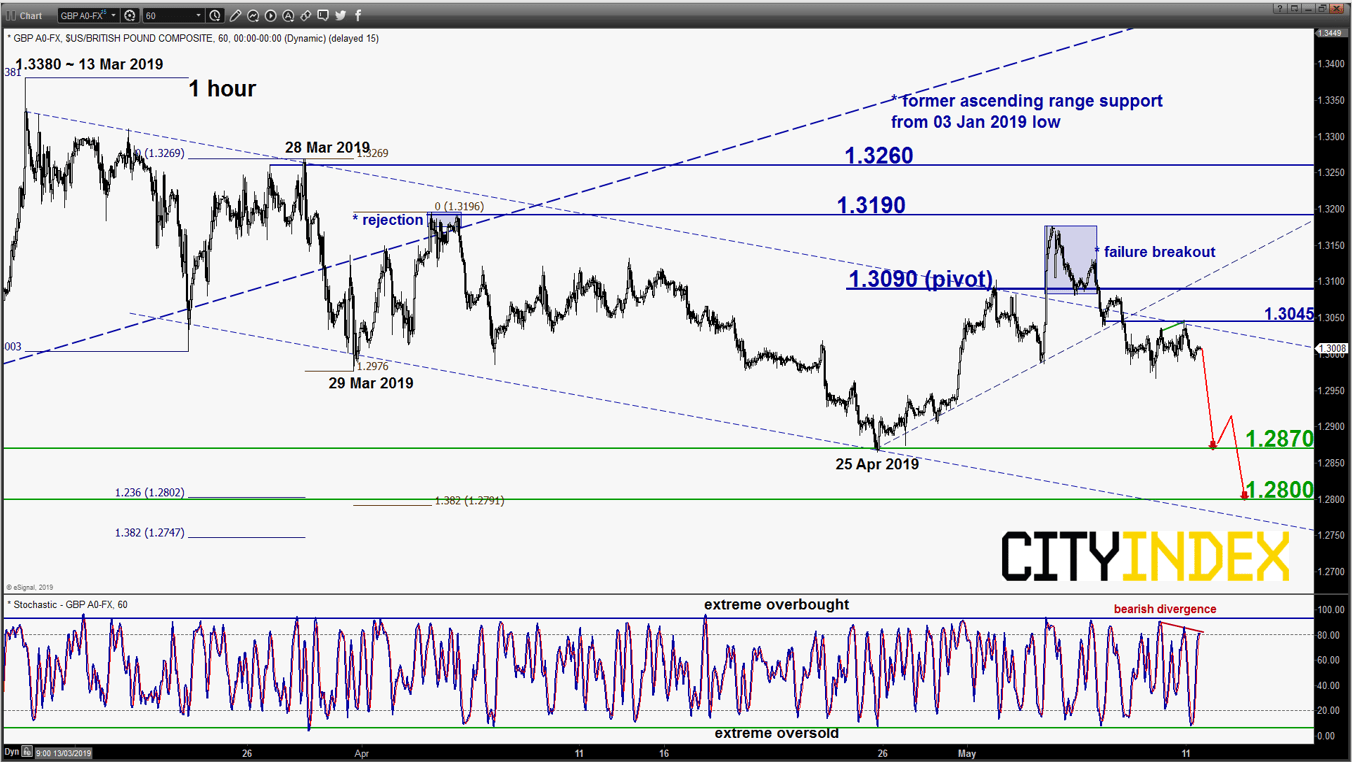
GBP/USD – Further potential decline within range in progress
click to enlarge chart
- Reacted off from the 1.3045 intermediate resistance on last Fri, 10 May after a challenge on it coupled with a bearish divergence signal seen in the hourly Stochastic oscillator at its overbought region. No change, maintain bearish bias with 1.3090 remains as the key short-term pivotal resistance for a further potential push down to retest the 25 Apr 2019 low of 1.2870 follow by 1.2800 next (lower boundary of the descending channel & Fibonacci retracement/expansion cluster).
- However, an hourly close above 1.3090 invalidates the bearish tone for a squeeze up towards the next intermediate resistance at 1.3190.
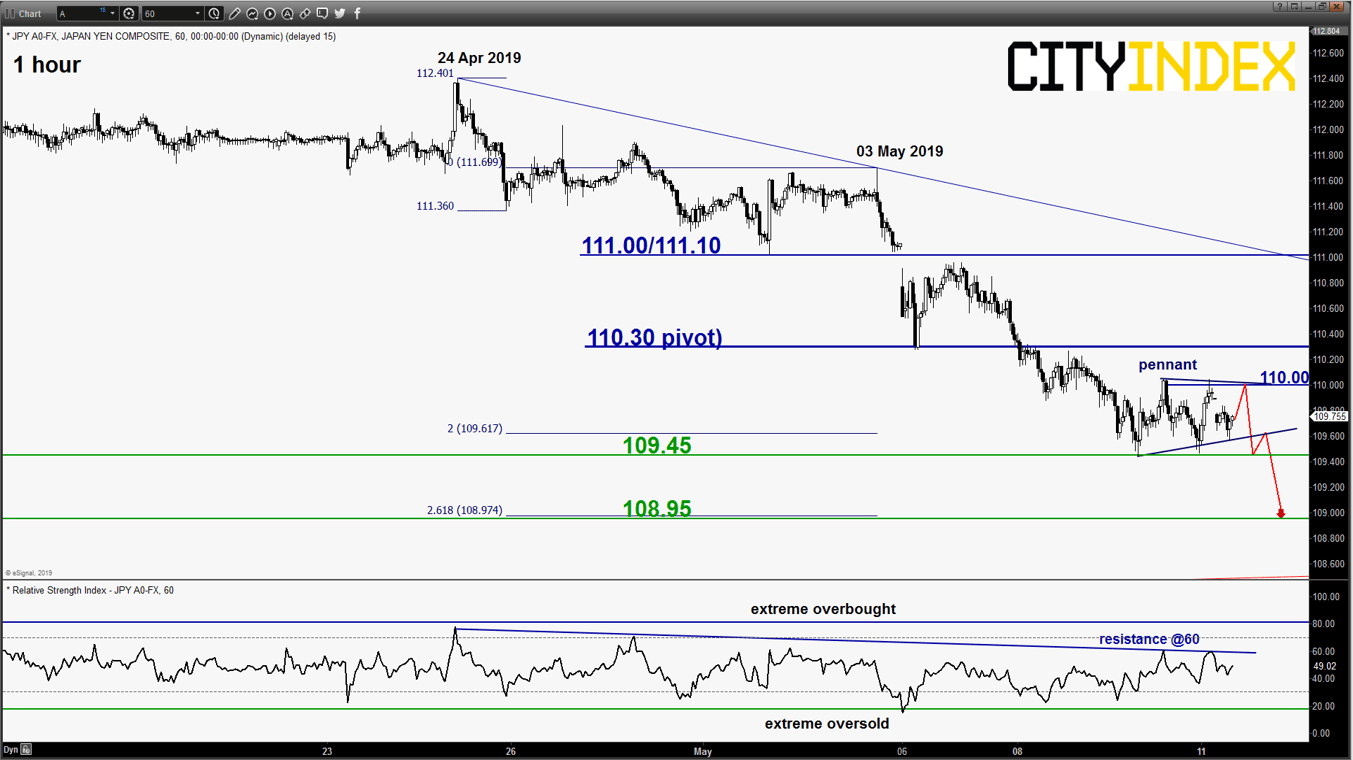
USD/JPY – 110.30 remains the key resistance to watch
click to enlarge chart
- Since last Thurs, 09 May low of 109.45, the pair has traded sideways with a 60 pips range and it has started to form a “Pennant” contracting range consolidation configuration below the 110.00 intermediate resistance. No change, maintain bearish bias with 110.30 remains the key short-term pivotal resistance and a break below 109.45 reinforces a further potential drop to target the next near-term support at 108.95 in the first step (Fibonacci expansion cluster & 31 Jan 2019 swing low area).
- However, an hourly close above 110.30 negates the bearish tone up towards the next intermediate resistance at 111.00/111.10 (06 May 2019 gapped down, pull-back resistance of the former ascending support from 03 Jan 2019 flash crash swing low area & descending trendline from 24 Apr 2019 high).
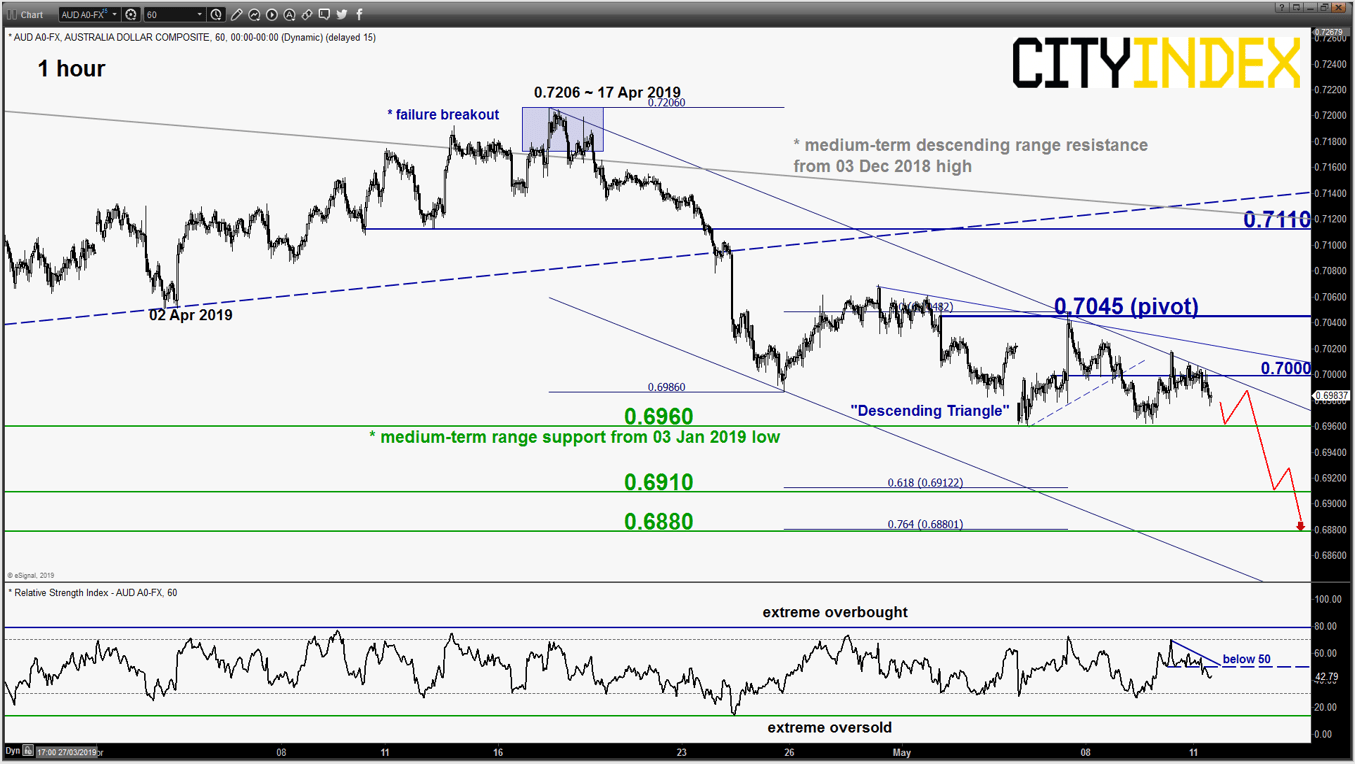
AUD/USD – Vulnerable for a bearish breakdown
click to enlarge chart
- Since the retest on the 0.6980/6960 medium-term range support in place since 03 Jan 2019 on last Mon, 06 May, its price action has evolved into a bearish “Descending Triangle” range configuration with intermediate resistance at 0.7000. No change, maintain bearish bias with 0.7045 remains as the short-term pivotal resistance (also the swing high formed post RBA) and a 4-hour close below 0.6960 reinforces a bearish breakdown below its medium-term range support to target the next near-term support at 0.6910 follow by 0.6880 next in the first step.
- However, an hourly close above 0.7045 invalidates the bearish tone for a squeeze up to retest the 0.7110 key medium-term resistance.
Charts are from eSignal
StoneX Financial Ltd (trading as “City Index”) is an execution-only service provider. This material, whether or not it states any opinions, is for general information purposes only and it does not take into account your personal circumstances or objectives. This material has been prepared using the thoughts and opinions of the author and these may change. However, City Index does not plan to provide further updates to any material once published and it is not under any obligation to keep this material up to date. This material is short term in nature and may only relate to facts and circumstances existing at a specific time or day. Nothing in this material is (or should be considered to be) financial, investment, legal, tax or other advice and no reliance should be placed on it.
No opinion given in this material constitutes a recommendation by City Index or the author that any particular investment, security, transaction or investment strategy is suitable for any specific person. The material has not been prepared in accordance with legal requirements designed to promote the independence of investment research. Although City Index is not specifically prevented from dealing before providing this material, City Index does not seek to take advantage of the material prior to its dissemination. This material is not intended for distribution to, or use by, any person in any country or jurisdiction where such distribution or use would be contrary to local law or regulation.
For further details see our full non-independent research disclaimer and quarterly summary.
CFDs are complex instruments and come with a high risk of losing money rapidly due to leverage. 69% of retail investor accounts lose money when trading CFDs with this provider. You should consider whether you understand how CFDs work and whether you can afford to take the high risk of losing your money. CFD and Forex Trading are leveraged products and your capital is at risk. They may not be suitable for everyone. Please ensure you fully understand the risks involved by reading our full risk warning.
City Index is a trading name of StoneX Financial Ltd. Head and Registered Office: 1st Floor, Moor House, 120 London Wall, London, EC2Y 5ET. StoneX Financial Ltd is a company registered in England and Wales, number: 05616586. Authorised and regulated by the Financial Conduct Authority. FCA Register Number: 446717.
City Index is a trademark of StoneX Financial Ltd.
The information on this website is not targeted at the general public of any particular country. It is not intended for distribution to residents in any country where such distribution or use would contravene any local law or regulatory requirement.
© City Index 2024