Daily Forex Technical Trend Bias Key Levels Tues 25 Jun
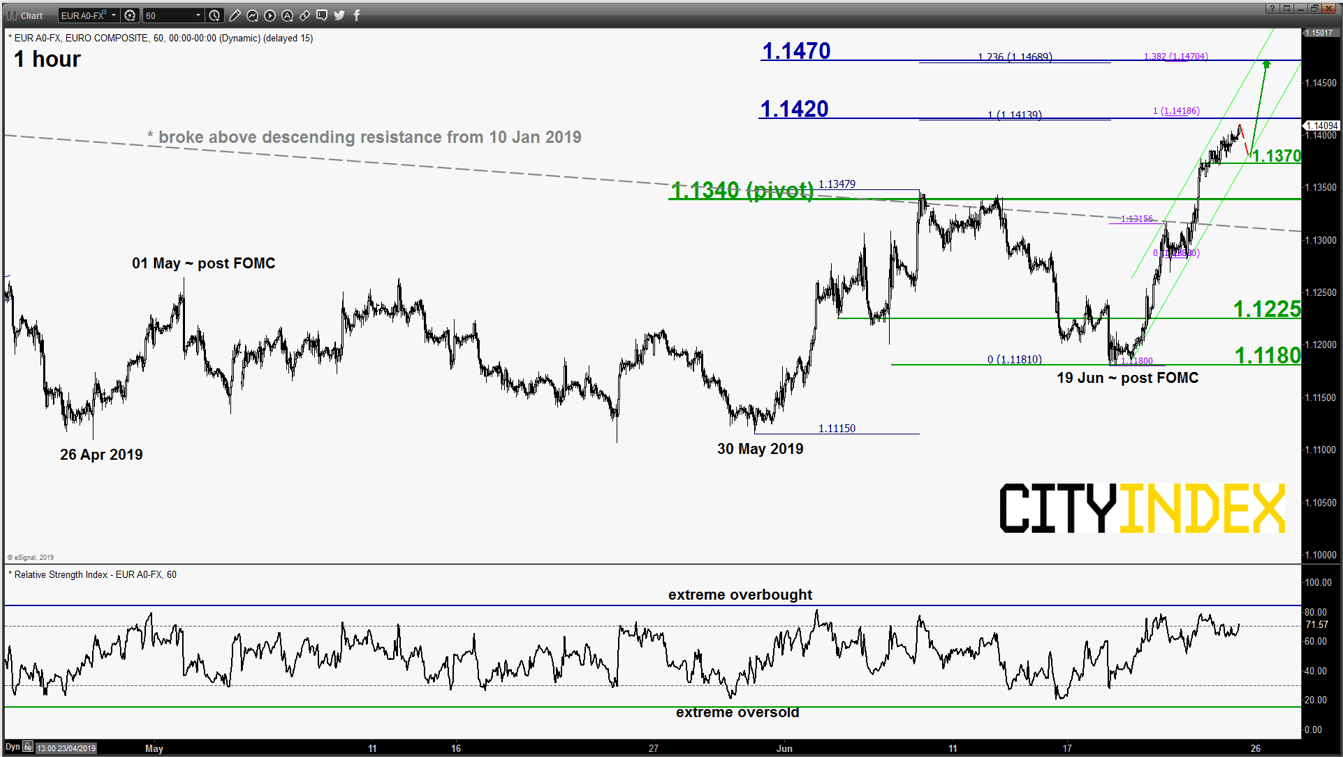
EUR/USD – Further push up above 1.1340 key support
click to enlarge chart
- Clear bullish break above the 1.1350 upper limit of the neutrality zone as per highlighted in our previous report, also the former descending resistance from 10 Jan 2019 swing high has validated the extension of the corrective rebound in place since 30 May 2019 low. Click here for a recap.
- Flip to a bullish bias in any dips above the key short-term pivotal support at 1.1340 for a further potential push up towards the next intermediate resistance at 1.1470 (upper boundary of the minor ascending channel & Fibonacci expansion cluster). However, a break with an hourly close below 1.1340 invalidates the bullish scenario for a slide back towards the 1.1225/1180 support zone in the first step.
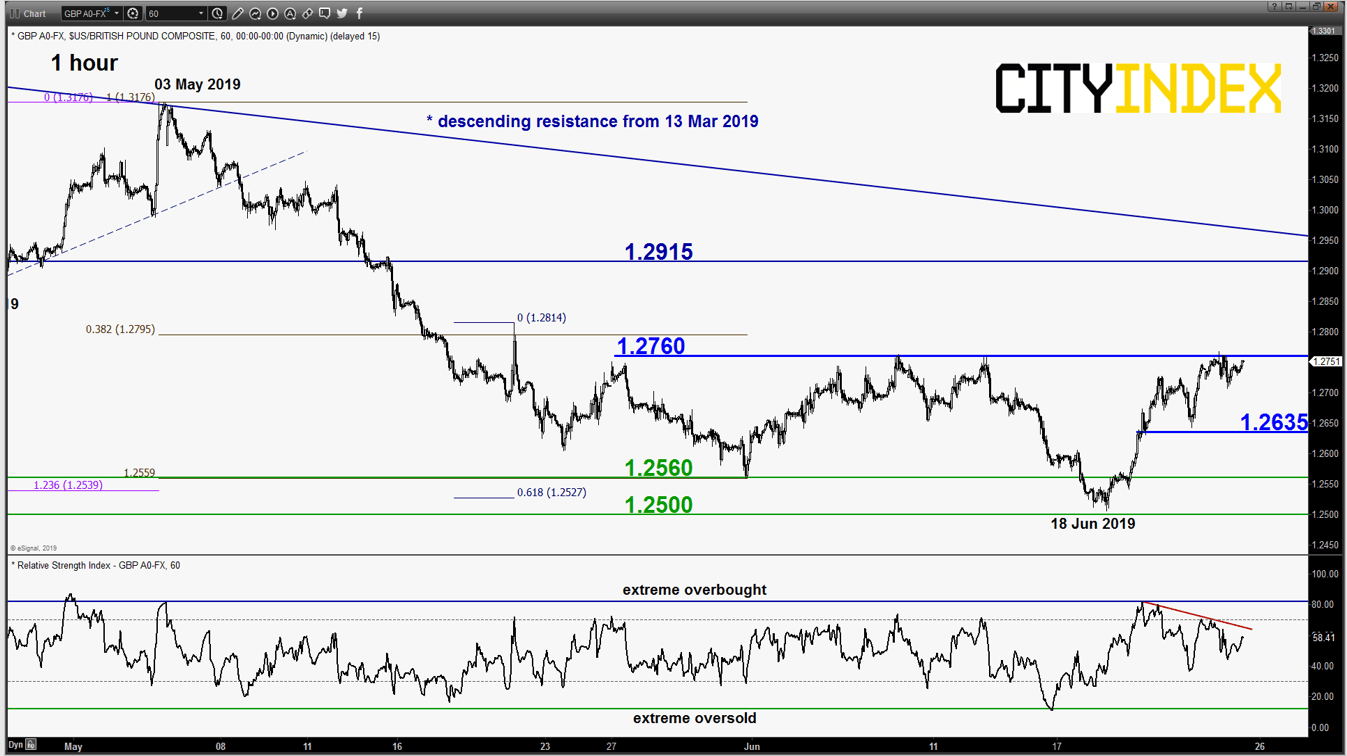
GBP/USD – Bearish conviction has been reduced, watch 1.2635 support
click to enlarge chart
- Recent push up in the past 2 days has managed to stall below the 1.2760 key short-term pivotal resistance as per highlighted in our previous report. However, the bearish conviction has been reduced due to the on-going USD weakness seen in the rest of the major pairs.
- Prefer to turn neutral between 1.2760 and 1.2635 where an hourly close below 1.2635 revives the bearish tone for a further potential push down to retest the 1.2560/1.2500 key support zone (major ascending support from Oct 2016 swing low).
- On the flipside, a break with an hourly close above 1.2760 sees an extension of the corrective rebound towards the next resistance at 1.2915.
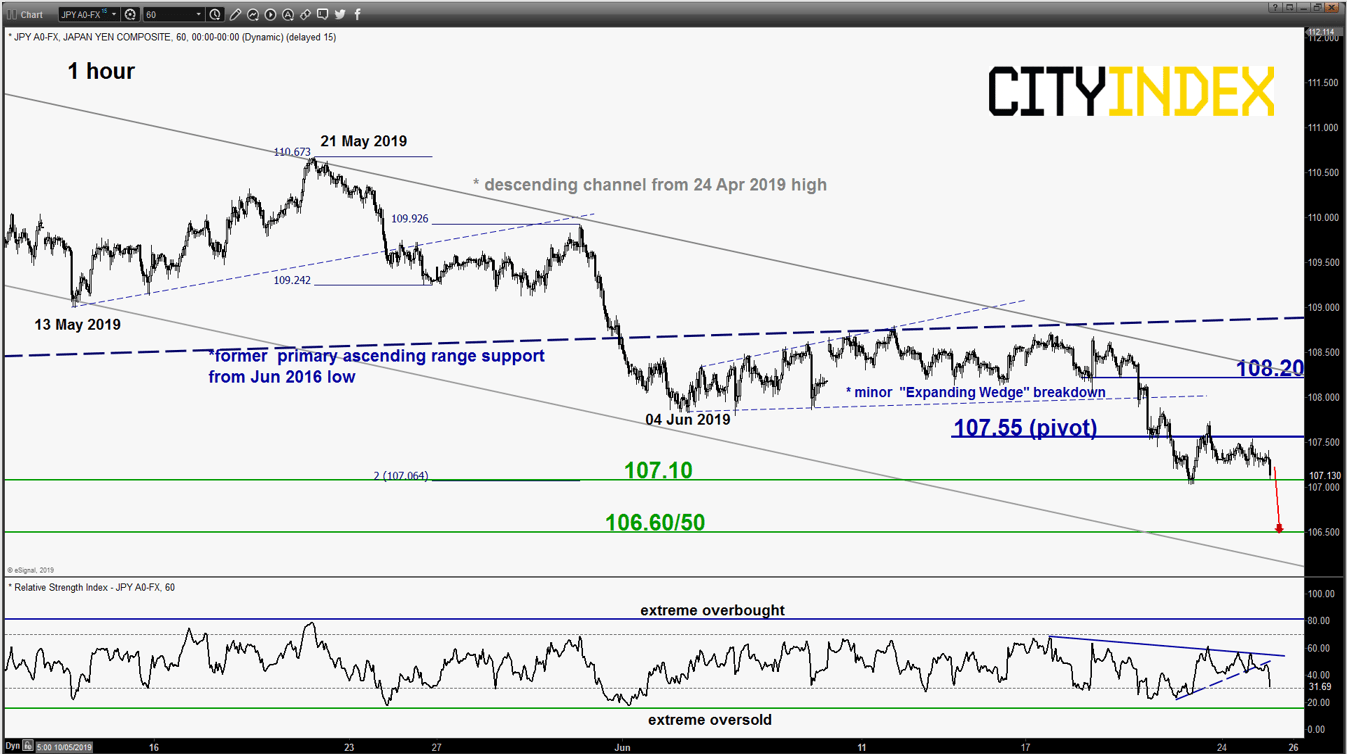
USD/JPY – Bears remain in control
click to enlarge chart
- Continued to inch down lower as expected to retest last Fri, 21 Jun swing low area of 107.10. Maintain bearish bias with a tightened key short-term pivotal resistance now at 107.55 for a further potential push down to target the next support at 106.60/50 (Fibonacci expansion cluster).
- However, a clearance with an hourly close above 107.55 negates the bearish tone for a corrective rebound towards the descending channel resistance at 108.20.
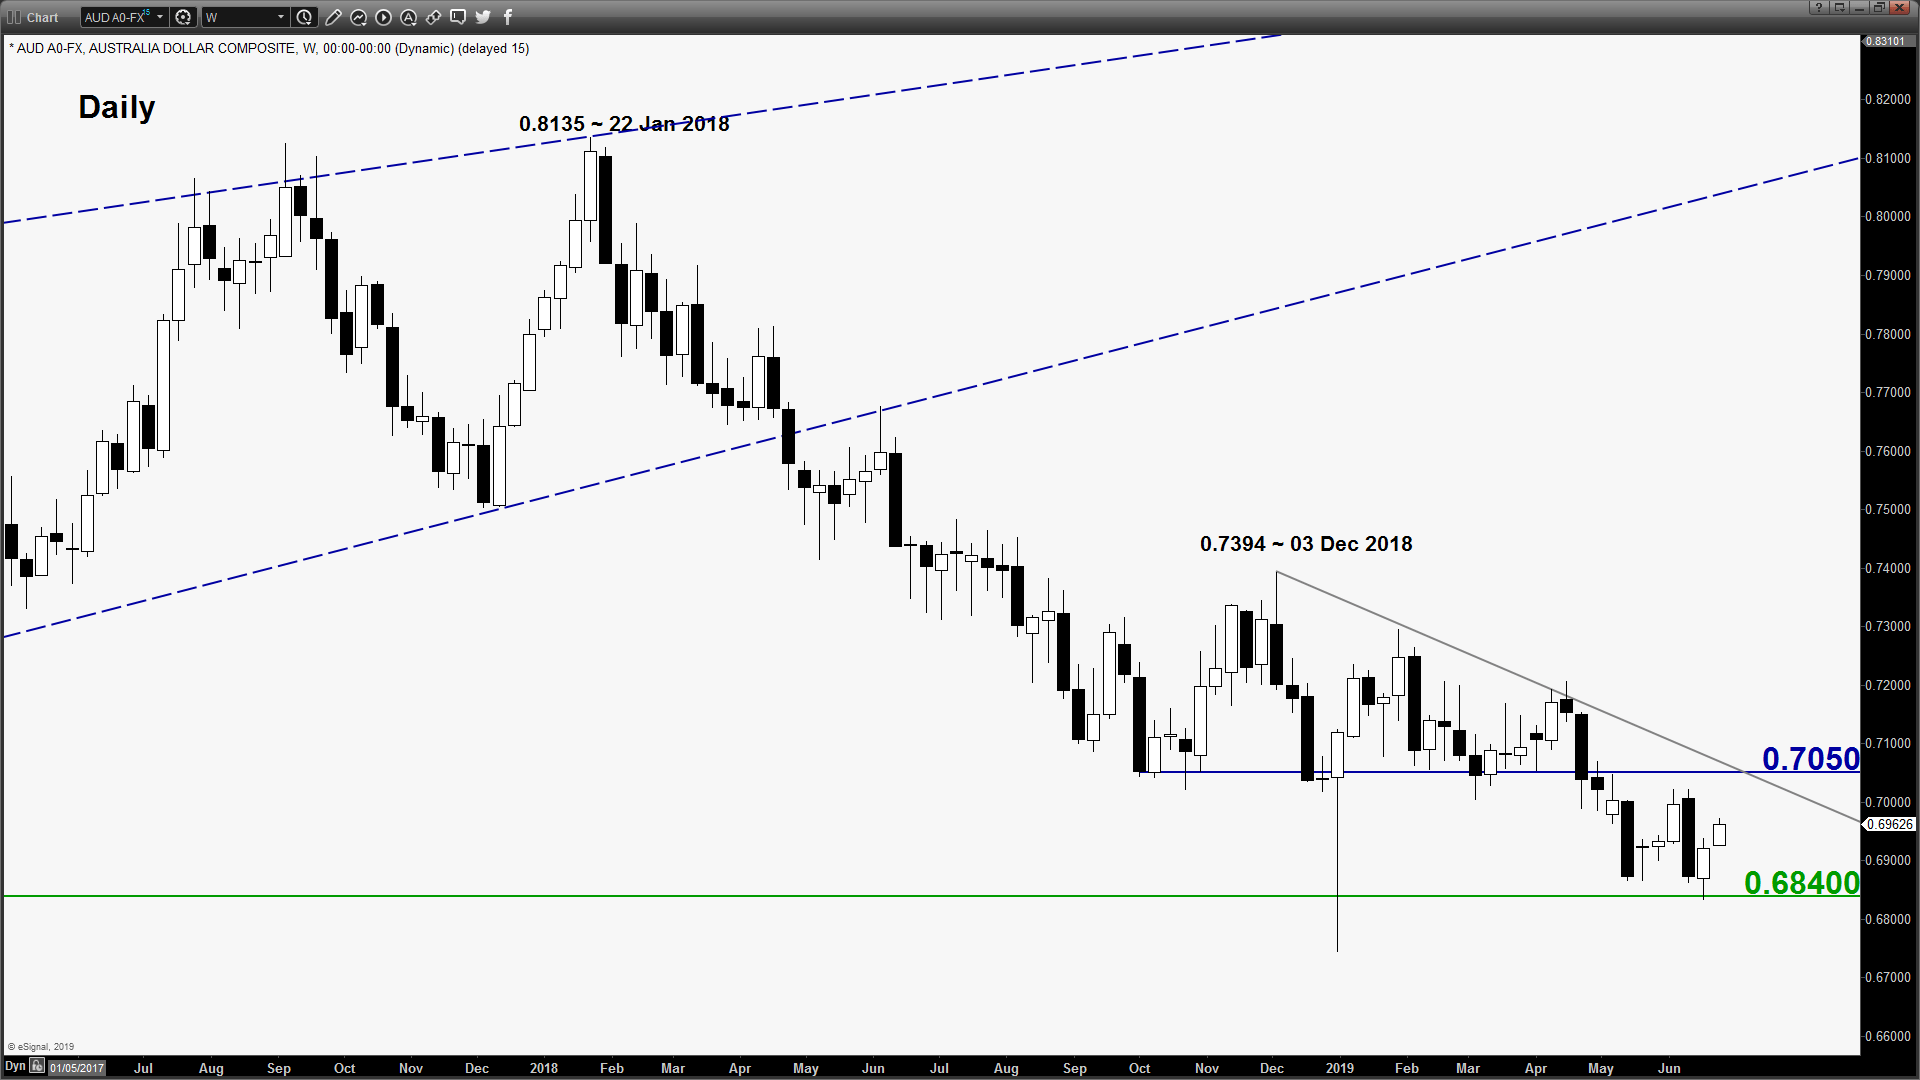
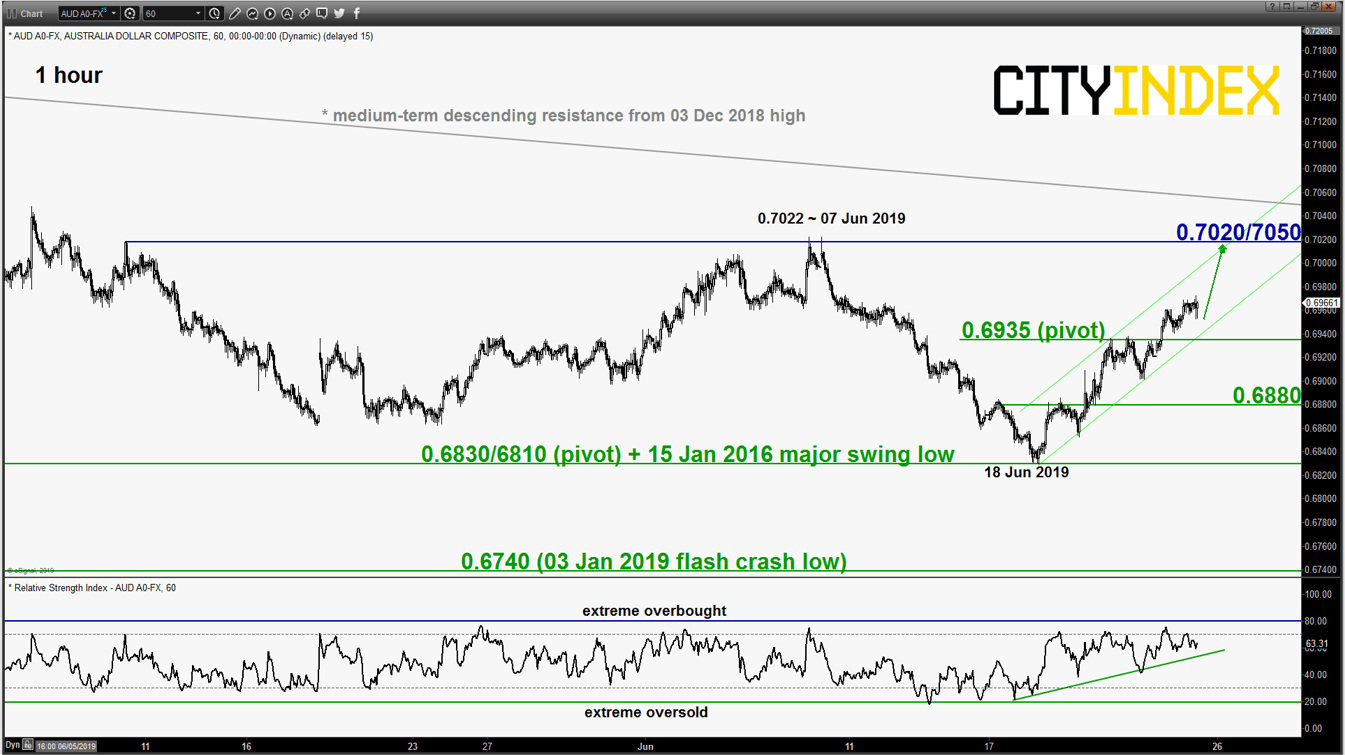
AUD/USD – Further push up towards key medium-term resistance
click to enlarge charts
- Broke above the 0.6935 key short-term resistance which has invalidated the bearish scenario. Flip back to a bullish bias with 0.6935 as the key short-term pivotal support for an extension of the corrective rebound to target the key medium-term resistance at 0.7020/7050 (also a Fibonacci expansion/retracement cluster & the minor ascending channel resistance).
- However, a break with an hourly close below 0.6935 revives the bears for a slide back towards the 0.6880/0.6830 support zone in the first step.
Charts are from eSignal
StoneX Financial Ltd (trading as “City Index”) is an execution-only service provider. This material, whether or not it states any opinions, is for general information purposes only and it does not take into account your personal circumstances or objectives. This material has been prepared using the thoughts and opinions of the author and these may change. However, City Index does not plan to provide further updates to any material once published and it is not under any obligation to keep this material up to date. This material is short term in nature and may only relate to facts and circumstances existing at a specific time or day. Nothing in this material is (or should be considered to be) financial, investment, legal, tax or other advice and no reliance should be placed on it.
No opinion given in this material constitutes a recommendation by City Index or the author that any particular investment, security, transaction or investment strategy is suitable for any specific person. The material has not been prepared in accordance with legal requirements designed to promote the independence of investment research. Although City Index is not specifically prevented from dealing before providing this material, City Index does not seek to take advantage of the material prior to its dissemination. This material is not intended for distribution to, or use by, any person in any country or jurisdiction where such distribution or use would be contrary to local law or regulation.
For further details see our full non-independent research disclaimer and quarterly summary.
CFDs are complex instruments and come with a high risk of losing money rapidly due to leverage. 69% of retail investor accounts lose money when trading CFDs with this provider. You should consider whether you understand how CFDs work and whether you can afford to take the high risk of losing your money. CFD and Forex Trading are leveraged products and your capital is at risk. They may not be suitable for everyone. Please ensure you fully understand the risks involved by reading our full risk warning.
City Index is a trading name of StoneX Financial Ltd. Head and Registered Office: 1st Floor, Moor House, 120 London Wall, London, EC2Y 5ET. StoneX Financial Ltd is a company registered in England and Wales, number: 05616586. Authorised and regulated by the Financial Conduct Authority. FCA Register Number: 446717.
City Index is a trademark of StoneX Financial Ltd.
The information on this website is not targeted at the general public of any particular country. It is not intended for distribution to residents in any country where such distribution or use would contravene any local law or regulatory requirement.
© City Index 2024