Daily Forex Technical Trend Bias Key Levels Thurs 20 Jun
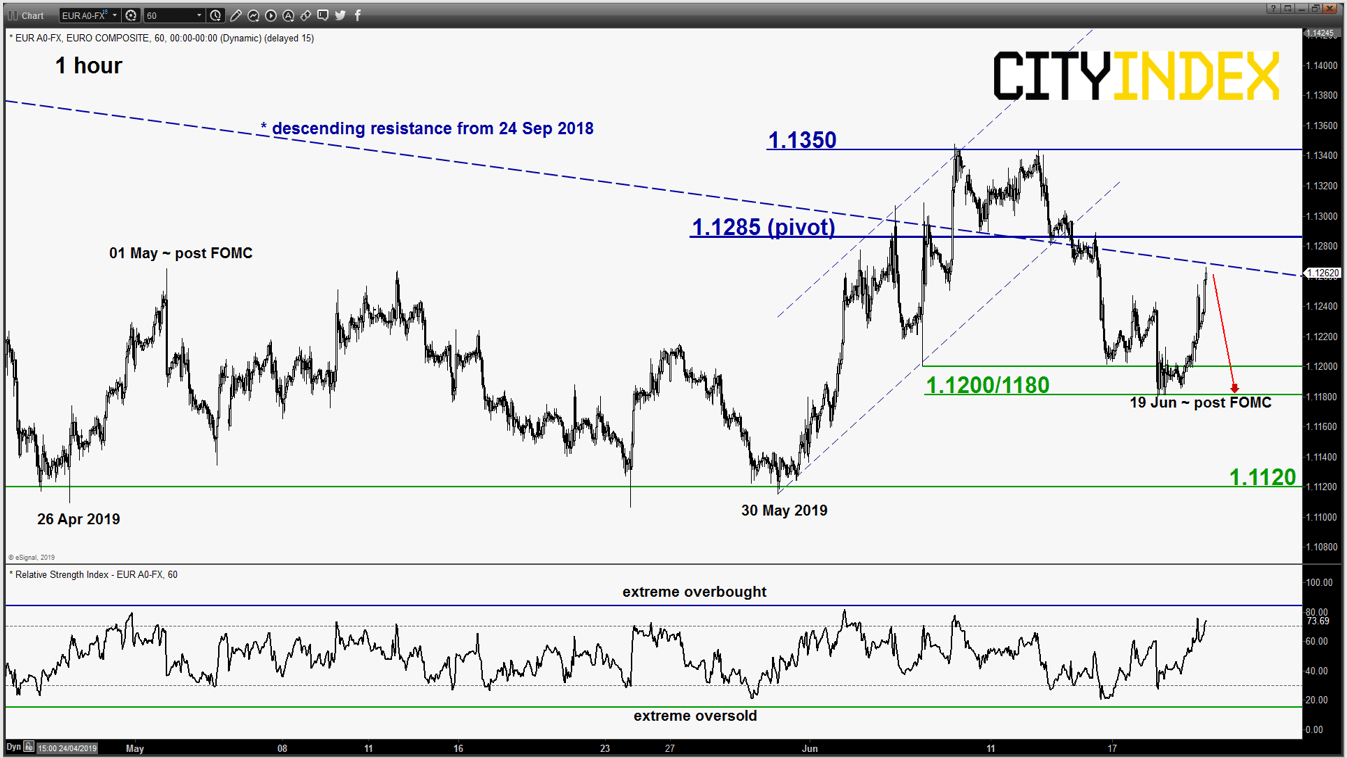
EUR/USD – Rallied up towards key resistance
click to enlarge chart
- Broke above 1.1220 that invalidated the preferred bearish scenario and squeezed up towards the alternate target/resistance of 1.1280. It has continued to inch higher in today’s Asian morning session as it printed a current intraday high of 1.1266 post FOMC where the Fed has signalled a rate cut in the Jul meeting.
- Yesterday’s push up has led the pair to hover just below the descending trendline from 24 Sep 2018 high now resistance at 1.1285 which also confluences with the 61.8% Fibonacci retracement of the recent slide from 07 Jun high to 18 Jun 2019 low. In addition, the push up has appeared to be “overstretched” as indicated by the hourly RSI oscillator now right below an extreme overbought level.
- Watch the key short-term pivotal resistance at 1.1285 for a potential slide back to retest the 1.1200/1180 near-term support. On the flipside, an hourly close above 1.1285 sees the continuation of the squeeze up towards 1.1350.
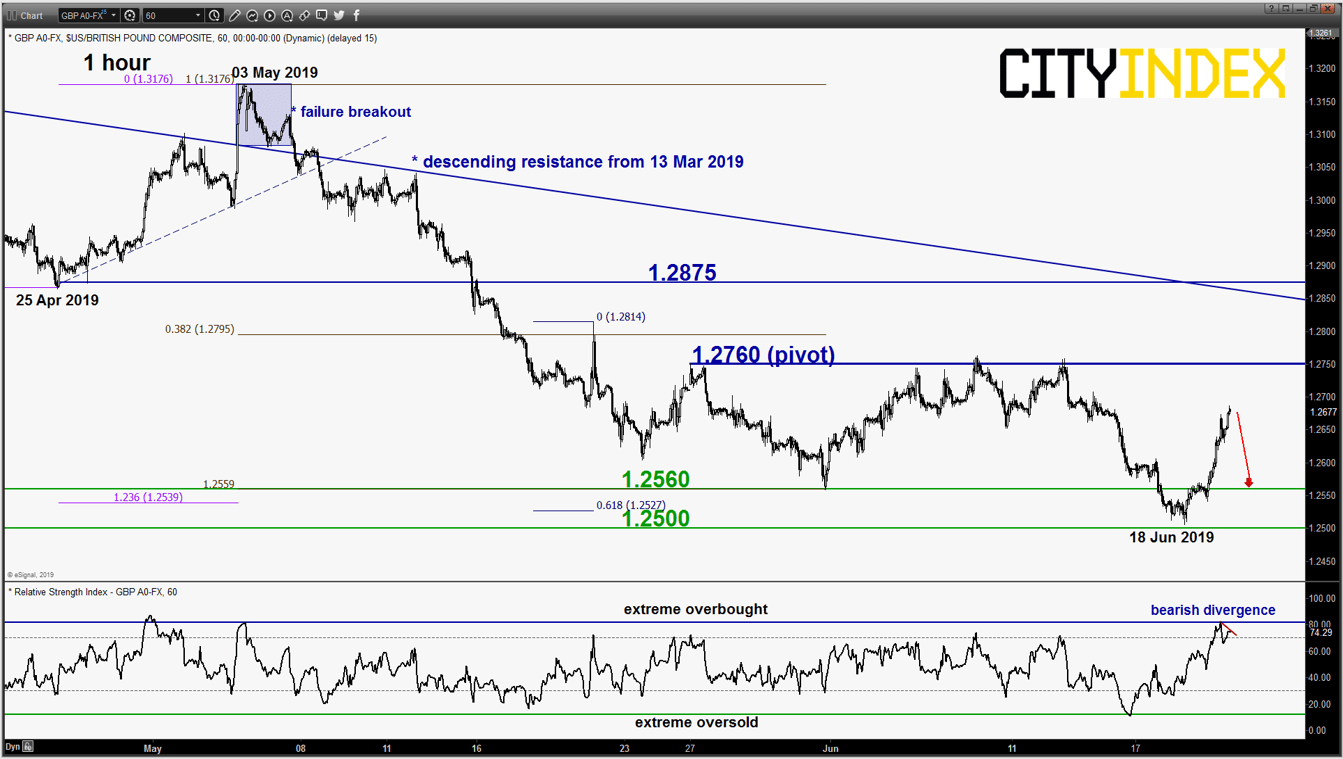
GBP/USD – Below key inflection level with bearish signal
click to enlarge chart
- Squeezed up as expected and hit the target/resistance of 1.2610/2650 post FOMC where it printed a current intraday high of 1.2687 in today’s Asian morning session (click here for a recap). Short-term momentum looks overstretched on the upside as the hourly RSI oscillator has flashed a bearish divergence signal at its extreme overbought level right below a key short-term inflection level of 1.2760 (also a Fibonacci retracement/expansion cluster).
- Flip to back to a bearish bias below 1.2760 key short-term pivotal resistance for a potential drop to retest 1.2560 with a maximum limit set at 1.2500 (the major ascending support from Oct 2016 low). On the flipside, an hourly close above 1.2760 invalidates the bearish scenario for a further squeeze up towards the next resistance at 1.2875.
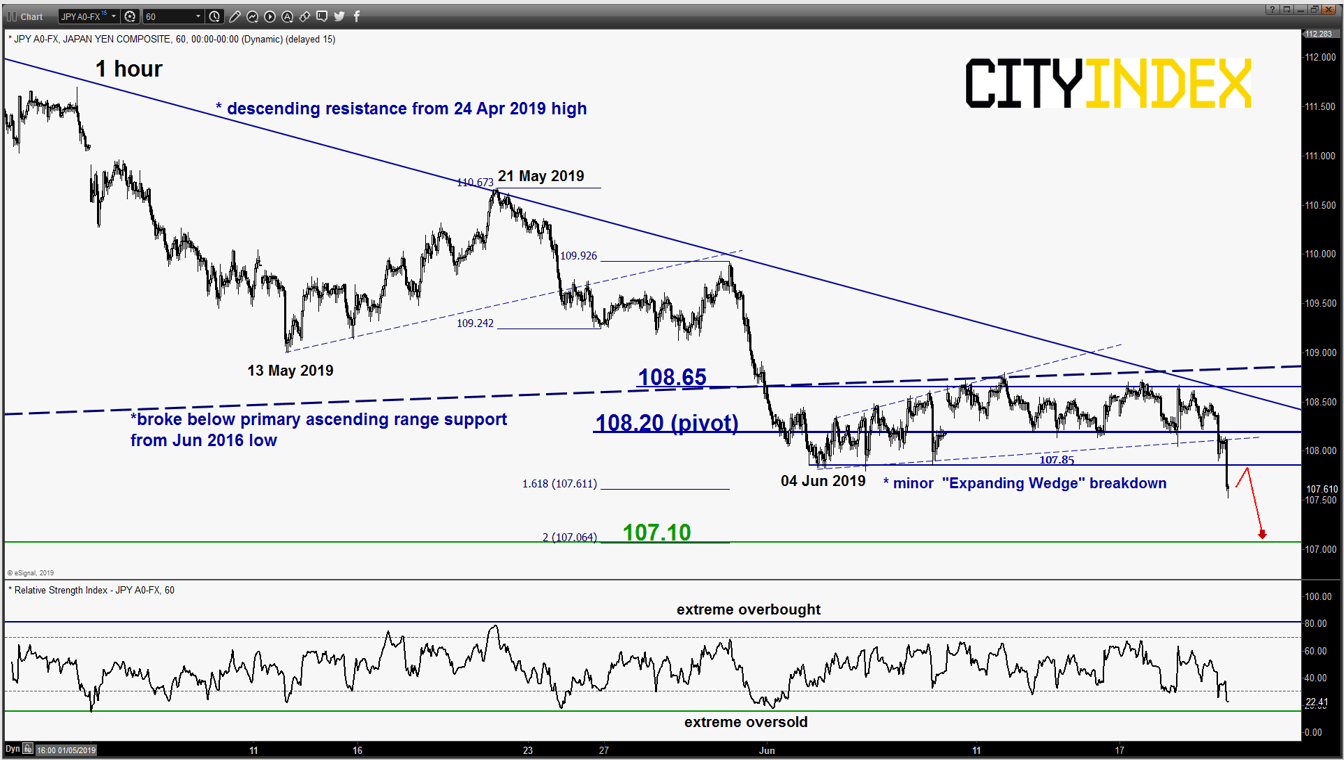
USD/JPY – Drop in progress
click to enlarge chart
- Staged the expected breakdown from the minor “Expanding Wedge” range configuration in motion since 04 Jun 2019. No clear signs of bearish exhaustion yet, maintain bearish bias with a tightened key short-term pivotal resistance now at 108.20 for a further potential drop towards the 107.10 support (Fibonacci expansion cluster).
- On the flipside, an hourly close above 108.20 negates the bearish tone for a push up to retest the 108.85 key medium-term resistance.
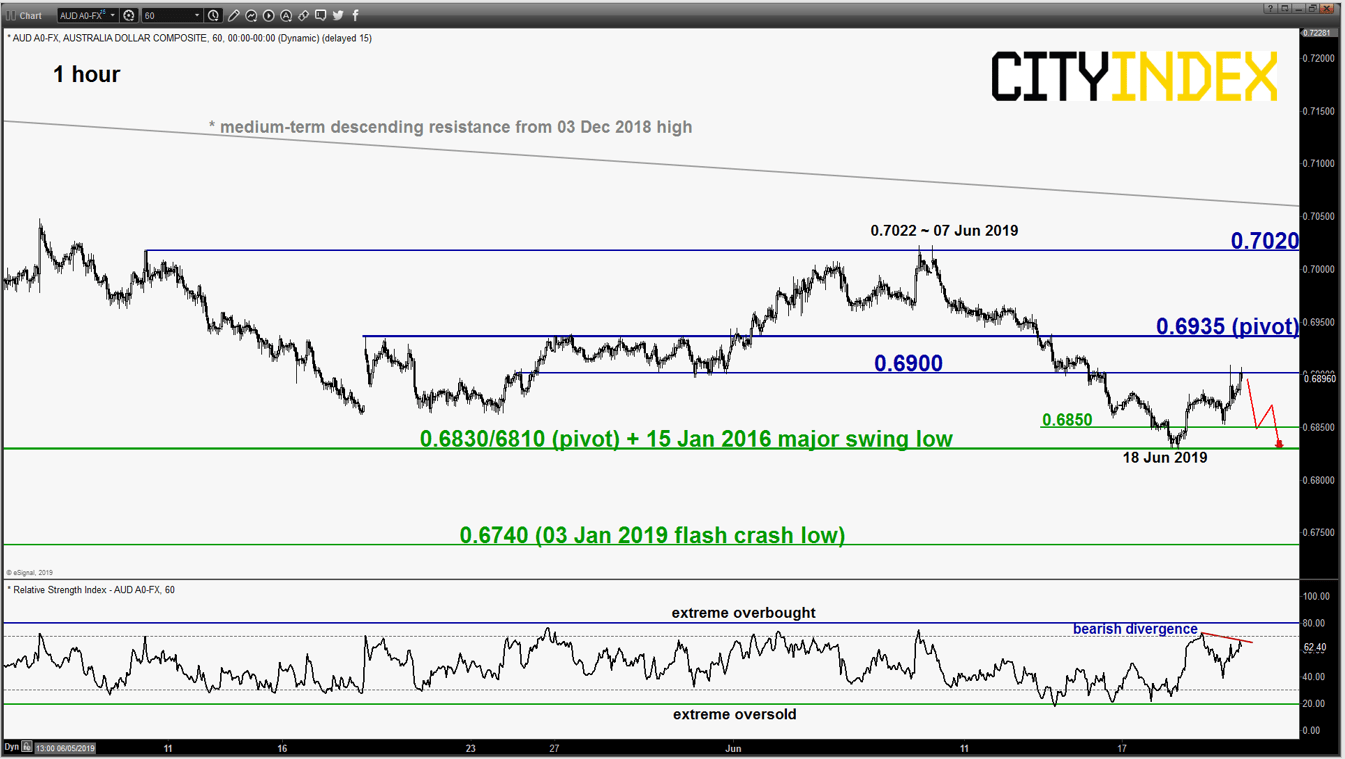
AUD/USD – Corrective rebound may have reached an exhaustion point
click to enlarge chart
- Pushed up as expected and hit the lower limit of the corrective rebound target at 0.6900 as per highlighted in our previous report. Right now, the hourly RSI oscillator has flashed a bearish divergence signal at its overbought region which indicates a slowdown in the recent upside momentum.
- Flip back to bearish bias below 0.6935 key short-term pivotal resistance for a potential push down to retest 0.6850 and the major support of 0.6830/6810. On the flipside, an hourly close above 0.6935 invalidates the bearish tone for a squeeze up towards the key medium-term resistance at 0.7020 (also the descending resistance from 03 Dec 2018 high).
Charts are from eSignal
StoneX Financial Ltd (trading as “City Index”) is an execution-only service provider. This material, whether or not it states any opinions, is for general information purposes only and it does not take into account your personal circumstances or objectives. This material has been prepared using the thoughts and opinions of the author and these may change. However, City Index does not plan to provide further updates to any material once published and it is not under any obligation to keep this material up to date. This material is short term in nature and may only relate to facts and circumstances existing at a specific time or day. Nothing in this material is (or should be considered to be) financial, investment, legal, tax or other advice and no reliance should be placed on it.
No opinion given in this material constitutes a recommendation by City Index or the author that any particular investment, security, transaction or investment strategy is suitable for any specific person. The material has not been prepared in accordance with legal requirements designed to promote the independence of investment research. Although City Index is not specifically prevented from dealing before providing this material, City Index does not seek to take advantage of the material prior to its dissemination. This material is not intended for distribution to, or use by, any person in any country or jurisdiction where such distribution or use would be contrary to local law or regulation.
For further details see our full non-independent research disclaimer and quarterly summary.
CFDs are complex instruments and come with a high risk of losing money rapidly due to leverage. 69% of retail investor accounts lose money when trading CFDs with this provider. You should consider whether you understand how CFDs work and whether you can afford to take the high risk of losing your money. CFD and Forex Trading are leveraged products and your capital is at risk. They may not be suitable for everyone. Please ensure you fully understand the risks involved by reading our full risk warning.
City Index is a trading name of StoneX Financial Ltd. Head and Registered Office: 1st Floor, Moor House, 120 London Wall, London, EC2Y 5ET. StoneX Financial Ltd is a company registered in England and Wales, number: 05616586. Authorised and regulated by the Financial Conduct Authority. FCA Register Number: 446717.
City Index is a trademark of StoneX Financial Ltd.
The information on this website is not targeted at the general public of any particular country. It is not intended for distribution to residents in any country where such distribution or use would contravene any local law or regulatory requirement.
© City Index 2024