Daily Forex Technical Trend Bias Key Levels Fri 28 Jun ahead of G20
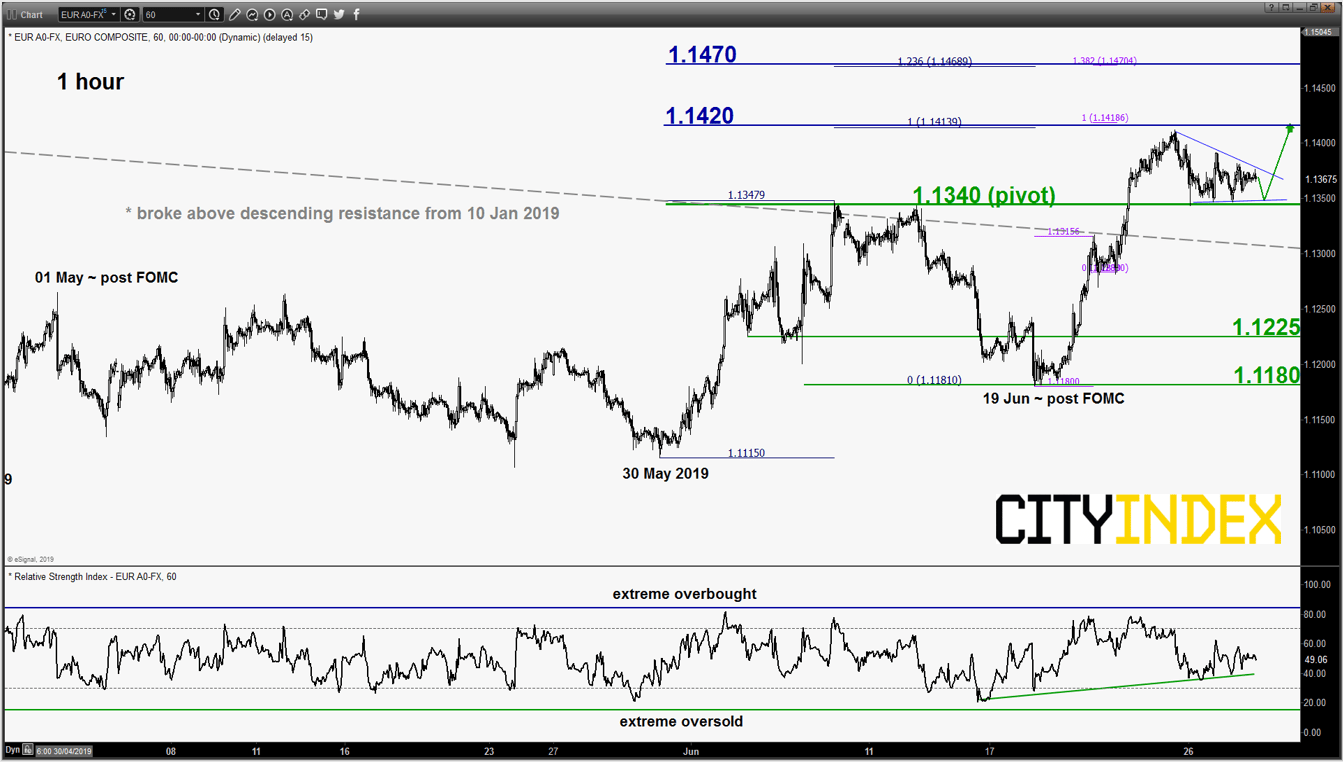
EUR/USD – Tight consolidation above 1.1340 key support
click to enlarge chart
- Continued to trade sideways after a test on the 1.1340 key short-term pivotal support. It has now started to evolve within a minor “pennant” contracting range configuration, maintain bullish bias for a potential push up to target the next intermediate resistance at 1.1420.
- On the other hand, a break with an hourly close below 1.1340 invalidates the bullish scenario for a slide back towards the 1.1225/1180 support zone in the first step.
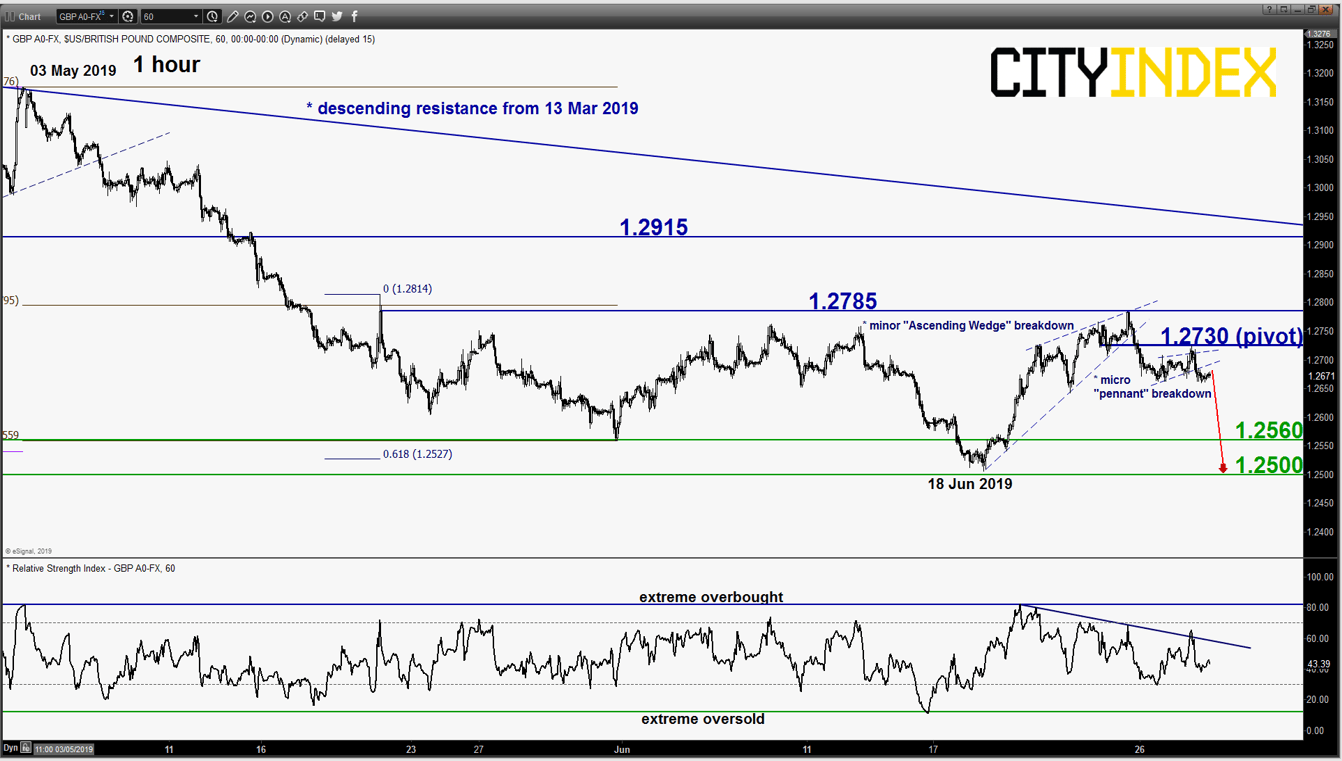
GBP/USD – Bears remains in control
click to enlarge chart
- Staged the expected bearish breakdown from the micro “pennant” range configuration in place since 26 Jun 2019 low as per highlighted in our previous report (click here for a recap). Maintain bearish bias with a tightened key short-term pivotal resistance at 1.2730 for a further potential push down to retest the major support zone of 1.2560/2500 (also the ascending trendline from Oct 2016 swing low).
- On the other hand, a break above 1.2730 negates the bearish tone for a retest on the recent range resistance of 1.2785. Only an hourly close above 1.2785 validates a corrective rebound scenario towards the next resistance at 1.2915 (also the descending trendline from 13 Mar 2019 high).
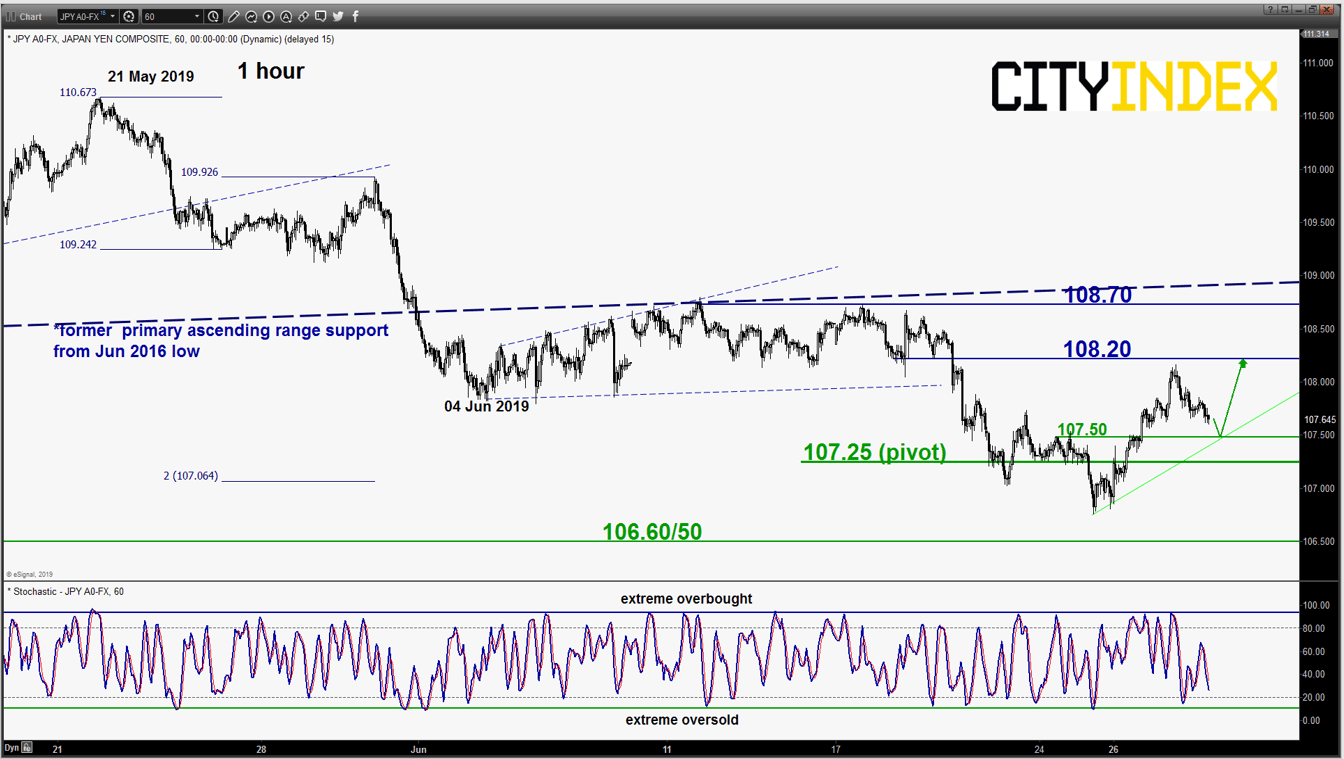
USD/JPY – Potential residual push up before medium-term down move resumes
click to enlarge chart
- Inched higher as expected and almost hit the upside/target of 108.20 as per highlighted in our previous report (printed a high of 108.16 in yesterday’s early European session.
- Elliot Wave/fractal analysis suggest that the minor corrective rebound in place since 106.75 low of 25 Jun 2019 may have a residual upleg left before the medium-term down move sequence resumes. Maintain bullish bias above 107.25 key short-term pivotal support for a residual potential push up to target 108.20 with a maximum limit set at the 108.70 key medium-term resistance.
- On the other hand, an hourly close below 107.25 revives the bears for a downleg towards the next support at 106.60/50.
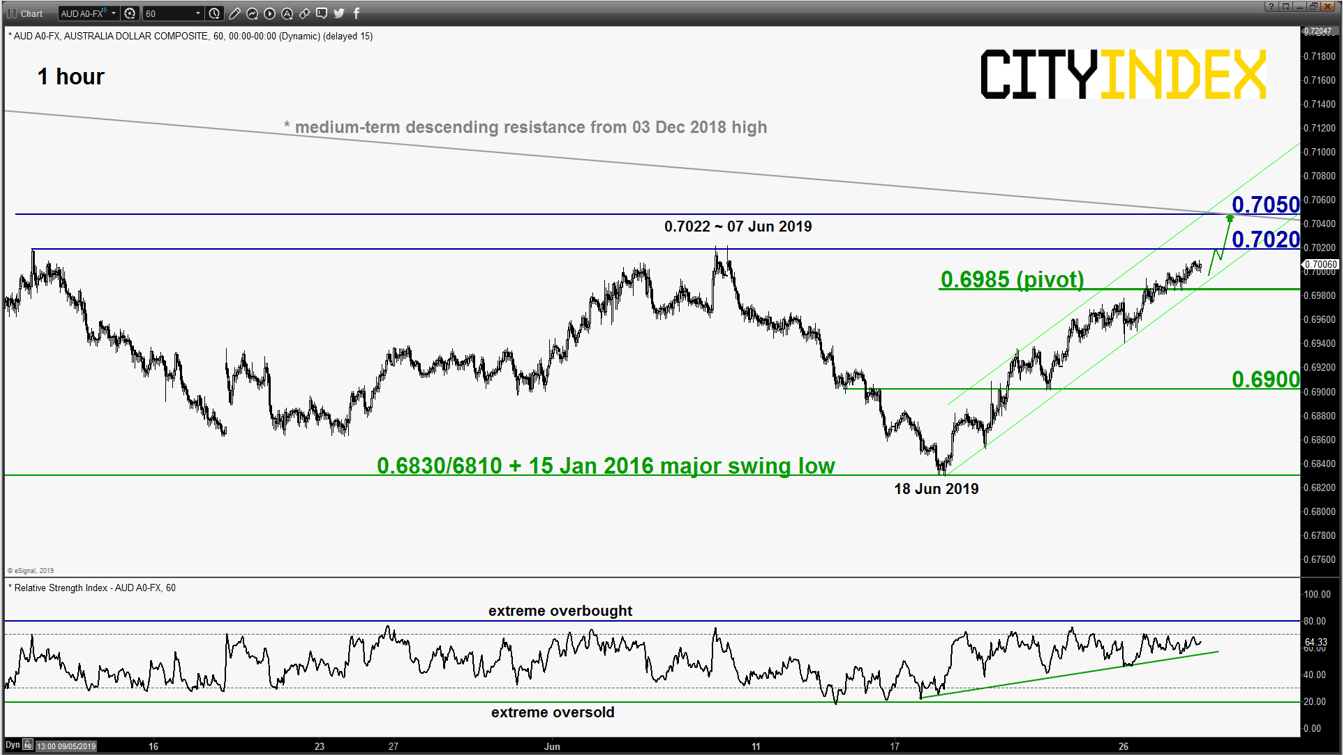
AUD/USD – Potential residual push up to end corrective rebound
click to enlarge chart
- Continued its slow grind upwards as expected as per highlighted in our previous report. Maintain bullish bias with an adjusted key short-term pivotal support now at 0.6985 for a potential residual push up to target 0.7020 follow by the key medium-term resistance at 0.7050 (also a Fibonacci expansion/retracement cluster & the minor ascending channel resistance from 18 Jun 2019).
- On the other hand, an hourly close below 0.6985 triggers the start of an impulsive downleg sequence to target the next near-term support at 0.6900 in the first step.
Charts are from eSignal
StoneX Financial Ltd (trading as “City Index”) is an execution-only service provider. This material, whether or not it states any opinions, is for general information purposes only and it does not take into account your personal circumstances or objectives. This material has been prepared using the thoughts and opinions of the author and these may change. However, City Index does not plan to provide further updates to any material once published and it is not under any obligation to keep this material up to date. This material is short term in nature and may only relate to facts and circumstances existing at a specific time or day. Nothing in this material is (or should be considered to be) financial, investment, legal, tax or other advice and no reliance should be placed on it.
No opinion given in this material constitutes a recommendation by City Index or the author that any particular investment, security, transaction or investment strategy is suitable for any specific person. The material has not been prepared in accordance with legal requirements designed to promote the independence of investment research. Although City Index is not specifically prevented from dealing before providing this material, City Index does not seek to take advantage of the material prior to its dissemination. This material is not intended for distribution to, or use by, any person in any country or jurisdiction where such distribution or use would be contrary to local law or regulation.
For further details see our full non-independent research disclaimer and quarterly summary.
CFDs are complex instruments and come with a high risk of losing money rapidly due to leverage. 69% of retail investor accounts lose money when trading CFDs with this provider. You should consider whether you understand how CFDs work and whether you can afford to take the high risk of losing your money. CFD and Forex Trading are leveraged products and your capital is at risk. They may not be suitable for everyone. Please ensure you fully understand the risks involved by reading our full risk warning.
City Index is a trading name of StoneX Financial Ltd. Head and Registered Office: 1st Floor, Moor House, 120 London Wall, London, EC2Y 5ET. StoneX Financial Ltd is a company registered in England and Wales, number: 05616586. Authorised and regulated by the Financial Conduct Authority. FCA Register Number: 446717.
City Index is a trademark of StoneX Financial Ltd.
The information on this website is not targeted at the general public of any particular country. It is not intended for distribution to residents in any country where such distribution or use would contravene any local law or regulatory requirement.
© City Index 2024