Daily Forex Technical Strategy Wed 21 Aug
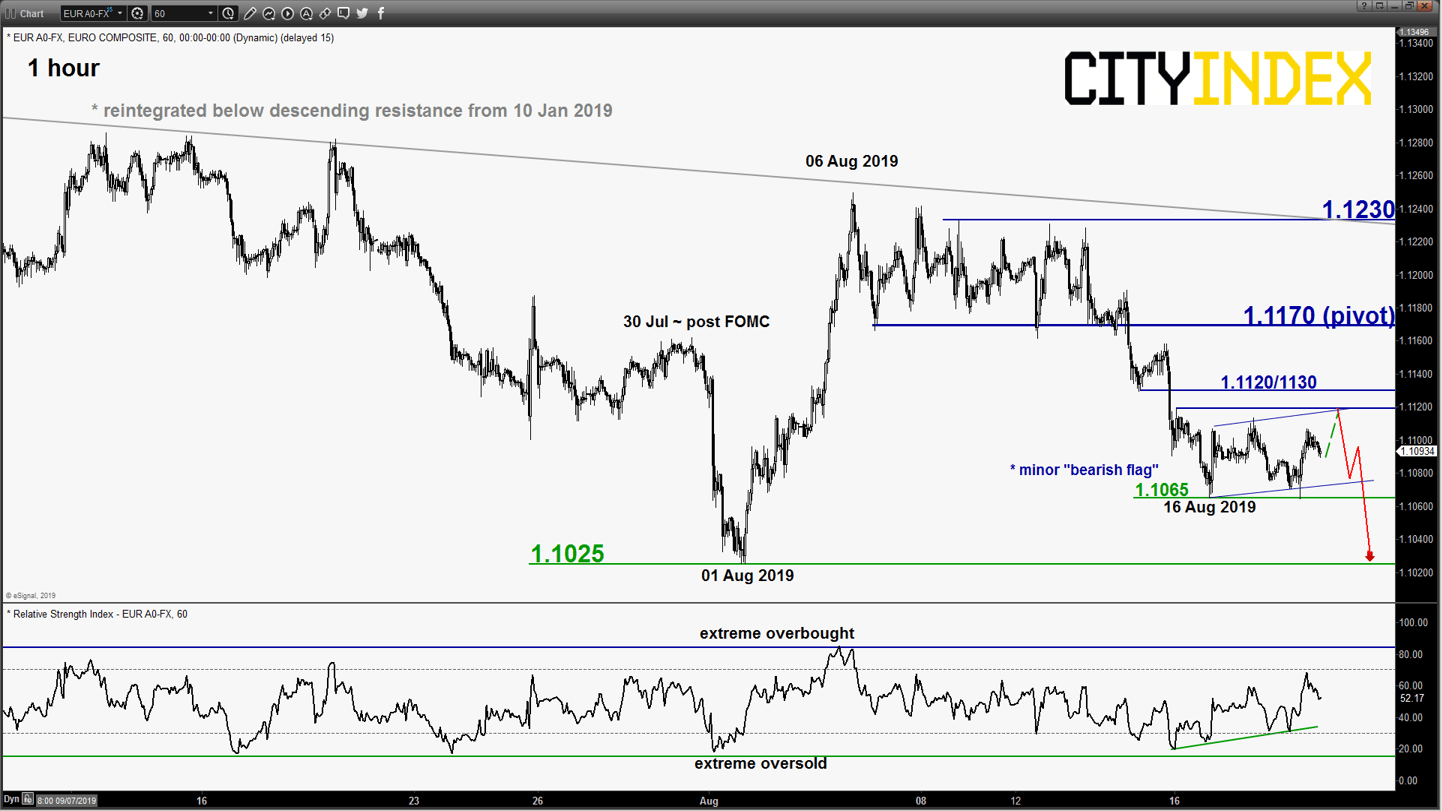
EUR/USD – Residual bounce before risk of new drop
click to enlarge chart
- The pair has shaped expected bounce within the minor “bearish flag” ascending range configuration in place since 16 Aug 2019. Rang top/resistance of the “bearish flag” remains at 1.1120/1130 (click here to recap our previous report).
- Maintain bearish bias in any bounces below 1.1170 key short-term pivotal resistance for another potential downleg to retest the 1.1025 near-term support in the first step.
- However, a clearance with an hourly close above 1.1170 negates the bearish tone for an extension of the corrective rebound towards the next resistance at 1.1230 (also the descending trendline from 10 Jan 2019 high).
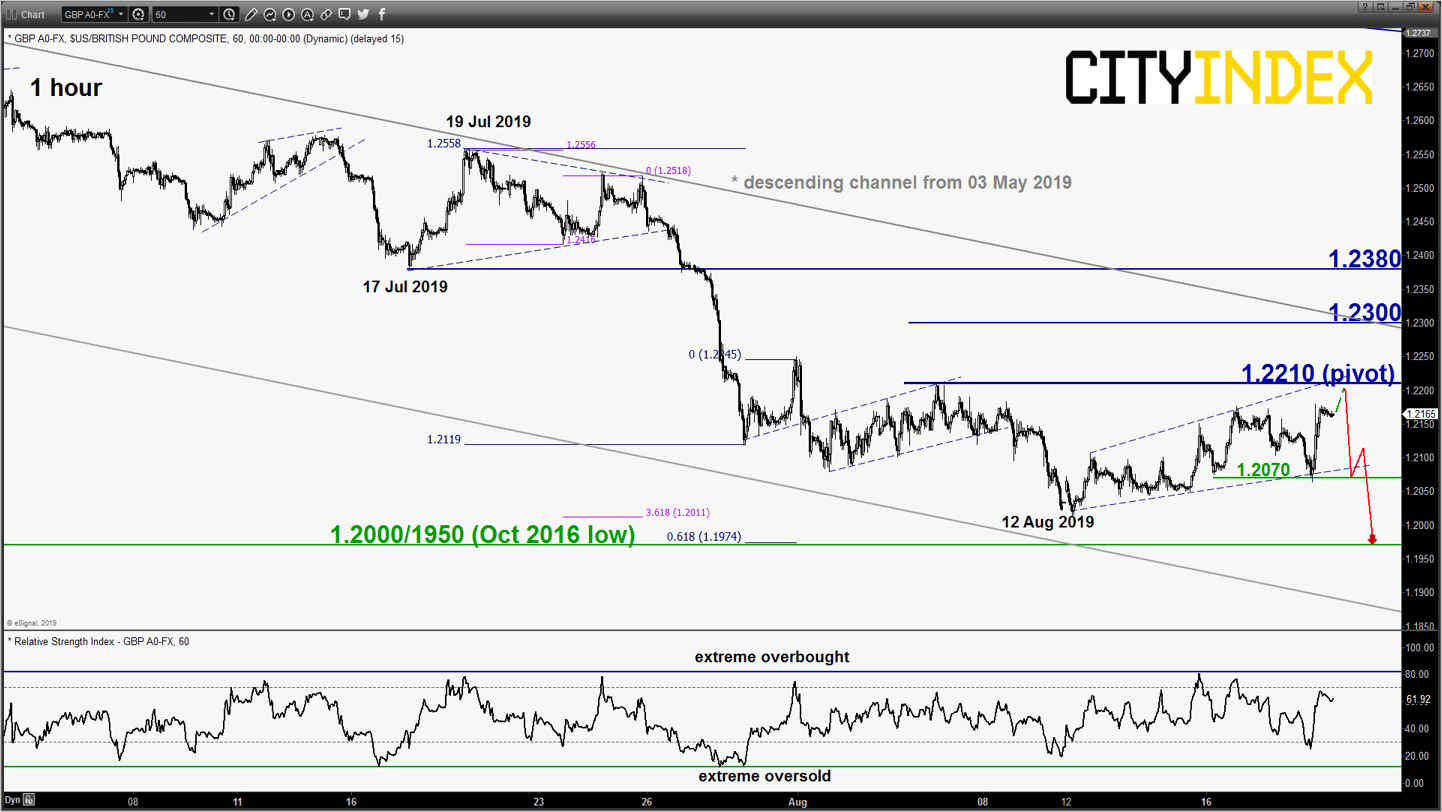
GBP/USD – 1.2210 remains the key resistance to watch
click to enlarge chart
- The pair pushed down, tested the 1.2095/2070 lower limit/support of a minor “Expanding Wedge” range configuration in place since 12 Aug 2019 before a bounce of 125 pips bounce to print a high of 1.2180 in yesterday’s U.S. session. The steep bounce came on the backdrop of potential “soft Brexit” revival after German Chancellor, Merkel commented that EU must think about practical solutions regarding the Irish backstop.
- The 1 -hour RSI oscillator is now coming close to an extreme overbought level. No change, maintain bearish bias with 1.2210 remains as the key short-term pivotal resistance (also the “Expanding Wedge” upper limit) for a potential push down to retest 1.2070 and a break below it may see a further drop to target the 1.2000/1950 support.
- However, a clearance with an hourly close above 1.2210 negates the bearish tone for an extended corrective rebound towards the medium-term descending channel resistance at 1.2300.
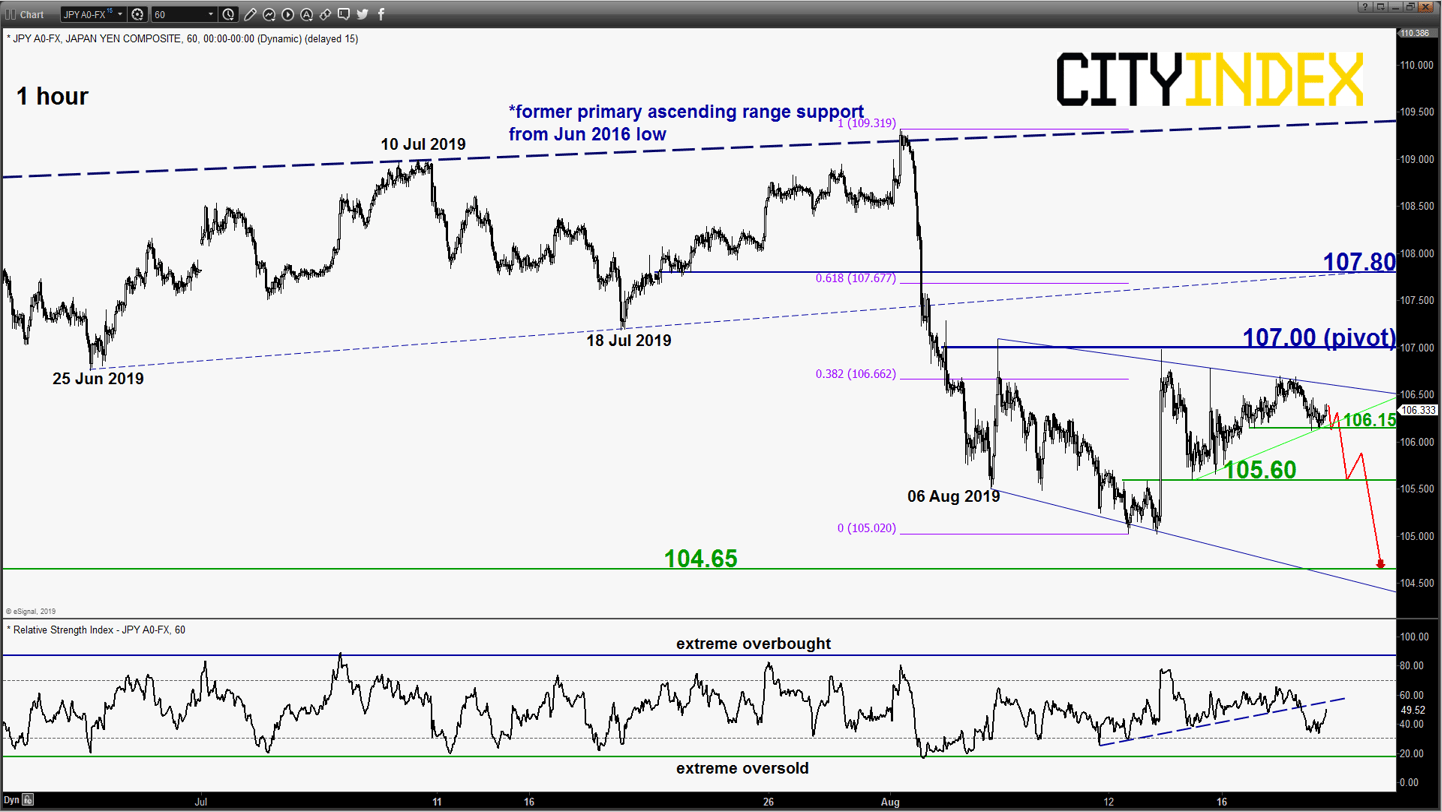
USD/JPY – Further potential downside below 107.00
click to enlarge chart
- The pair has staged the expected drift down from the upper limit/resistance of the minor “descending range” configuration in place since 06 Aug 2019. Tested the intermediate support at 106.15 and traded sideways thereafter.
- No change, maintain bearish bias below 107.00 key short-term pivotal resistance and a break below 106.15 is likely to see a potential drop towards 105.60 follow by 104.65 support (03 Jan 2019 flash crash low area & 22/23 Jan 2018 swing low). However, a clearance with an hourly close above 107.00 sees a squeeze up towards 107.80.
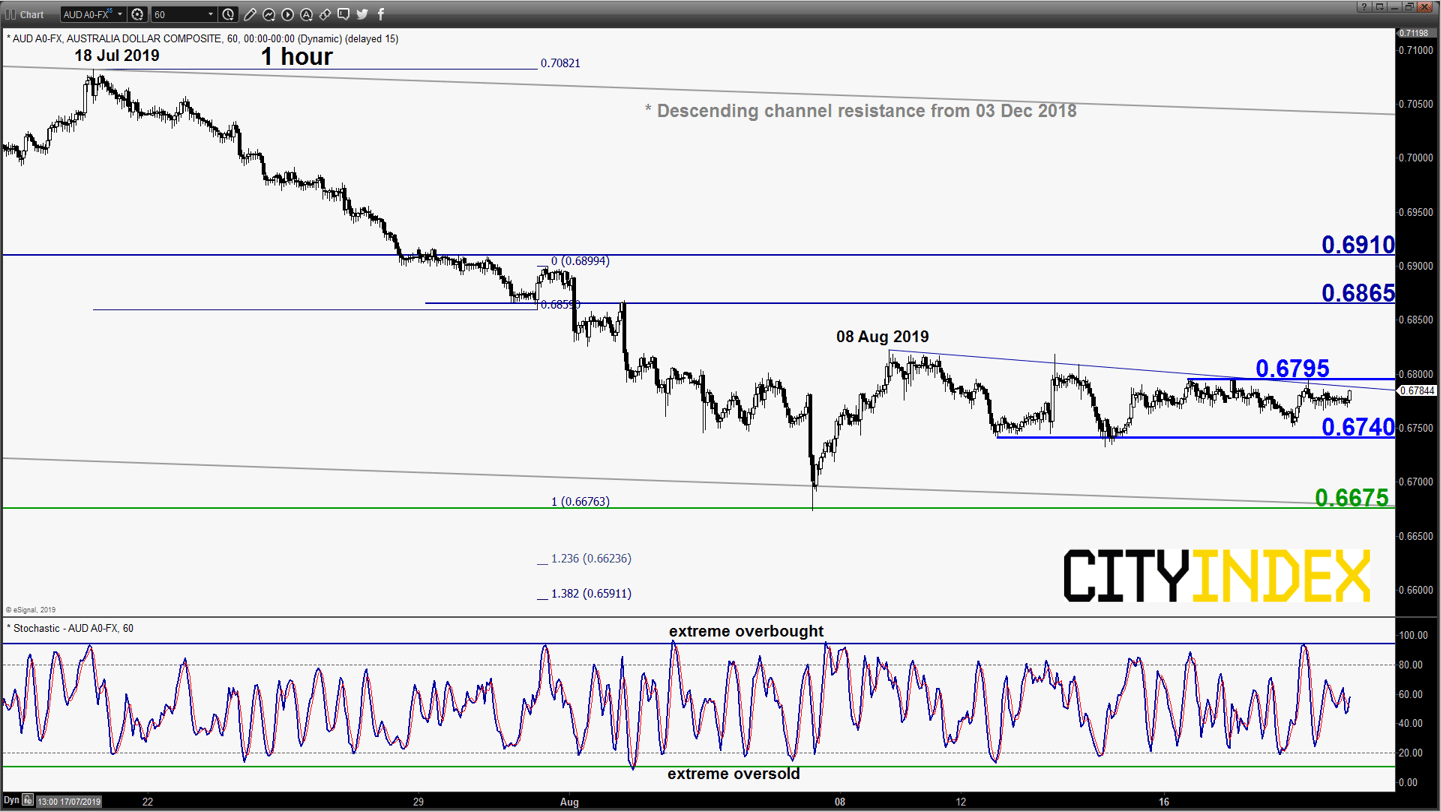
AUD/USD – Stuck inside a range configuration
click to enlarge chart
- Since its 08 Aug 2019 high of 0.6822, the pair has started to evolve within a minor “triangle” range configuration with upper and lower limits at 0.6795 and 0.6740 respectively.
- No change, maintain neutral stance between 0.6795 and 0.6740. Only an hourly close above 0.6795 validates a potential corrective rebound towards the next intermediate resistance at 0.6865. On the flipside, a break above 0.6795 sees an extension of the corrective rebound towards the next resistance at 0.6865 (also close to the 50% Fibonacci retracement of the recent steep decline from 18 Jul high to 07 Aug 2019 low).
Charts are from eSignal
StoneX Financial Ltd (trading as “City Index”) is an execution-only service provider. This material, whether or not it states any opinions, is for general information purposes only and it does not take into account your personal circumstances or objectives. This material has been prepared using the thoughts and opinions of the author and these may change. However, City Index does not plan to provide further updates to any material once published and it is not under any obligation to keep this material up to date. This material is short term in nature and may only relate to facts and circumstances existing at a specific time or day. Nothing in this material is (or should be considered to be) financial, investment, legal, tax or other advice and no reliance should be placed on it.
No opinion given in this material constitutes a recommendation by City Index or the author that any particular investment, security, transaction or investment strategy is suitable for any specific person. The material has not been prepared in accordance with legal requirements designed to promote the independence of investment research. Although City Index is not specifically prevented from dealing before providing this material, City Index does not seek to take advantage of the material prior to its dissemination. This material is not intended for distribution to, or use by, any person in any country or jurisdiction where such distribution or use would be contrary to local law or regulation.
For further details see our full non-independent research disclaimer and quarterly summary.
CFDs are complex instruments and come with a high risk of losing money rapidly due to leverage. 69% of retail investor accounts lose money when trading CFDs with this provider. You should consider whether you understand how CFDs work and whether you can afford to take the high risk of losing your money. CFD and Forex Trading are leveraged products and your capital is at risk. They may not be suitable for everyone. Please ensure you fully understand the risks involved by reading our full risk warning.
City Index is a trading name of StoneX Financial Ltd. Head and Registered Office: 1st Floor, Moor House, 120 London Wall, London, EC2Y 5ET. StoneX Financial Ltd is a company registered in England and Wales, number: 05616586. Authorised and regulated by the Financial Conduct Authority. FCA Register Number: 446717.
City Index is a trademark of StoneX Financial Ltd.
The information on this website is not targeted at the general public of any particular country. It is not intended for distribution to residents in any country where such distribution or use would contravene any local law or regulatory requirement.
© City Index 2024