Daily Forex Technical Strategy Wed 11 Dec
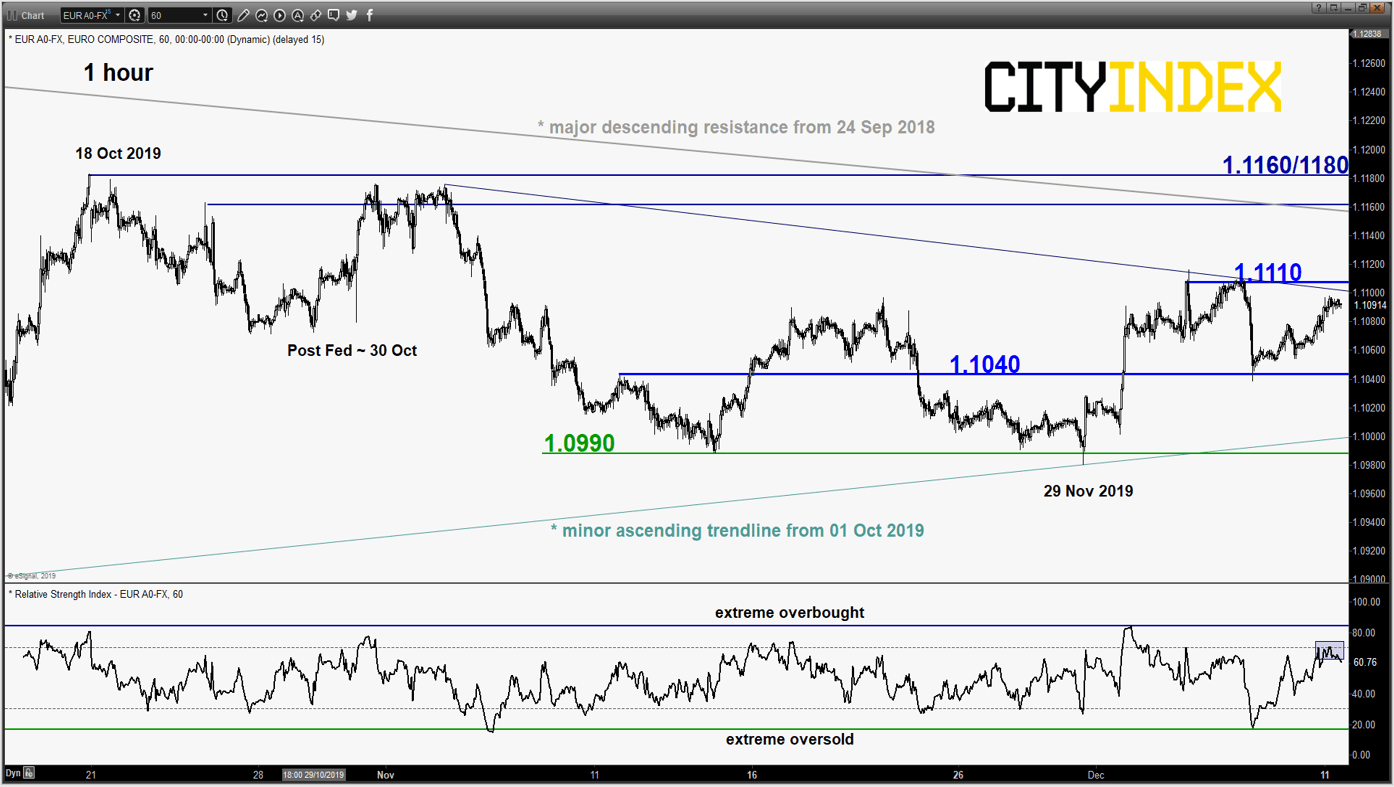
EUR/USD – Watch 1.1110 & 1.1040
click to enlarge chart
- Losses inflicted after last Fri’s 06 Dec better than expected U.S jobs data (NFP) has been reversed and the pair inched back up towards 1.1110.
- Mix elements; prefer to turn neutral first between 1.1110 and 1.1040. An hourly close above 1.1110 sees a squeeze up towards the 1.1160/1180 major descending resistance and the range top of 18 Oct/04 Nov 2019. Below 1.1040 sees a slide to retest 1.0990 minor range resistance and the ascending trendline from 01 Oct 2019 low.
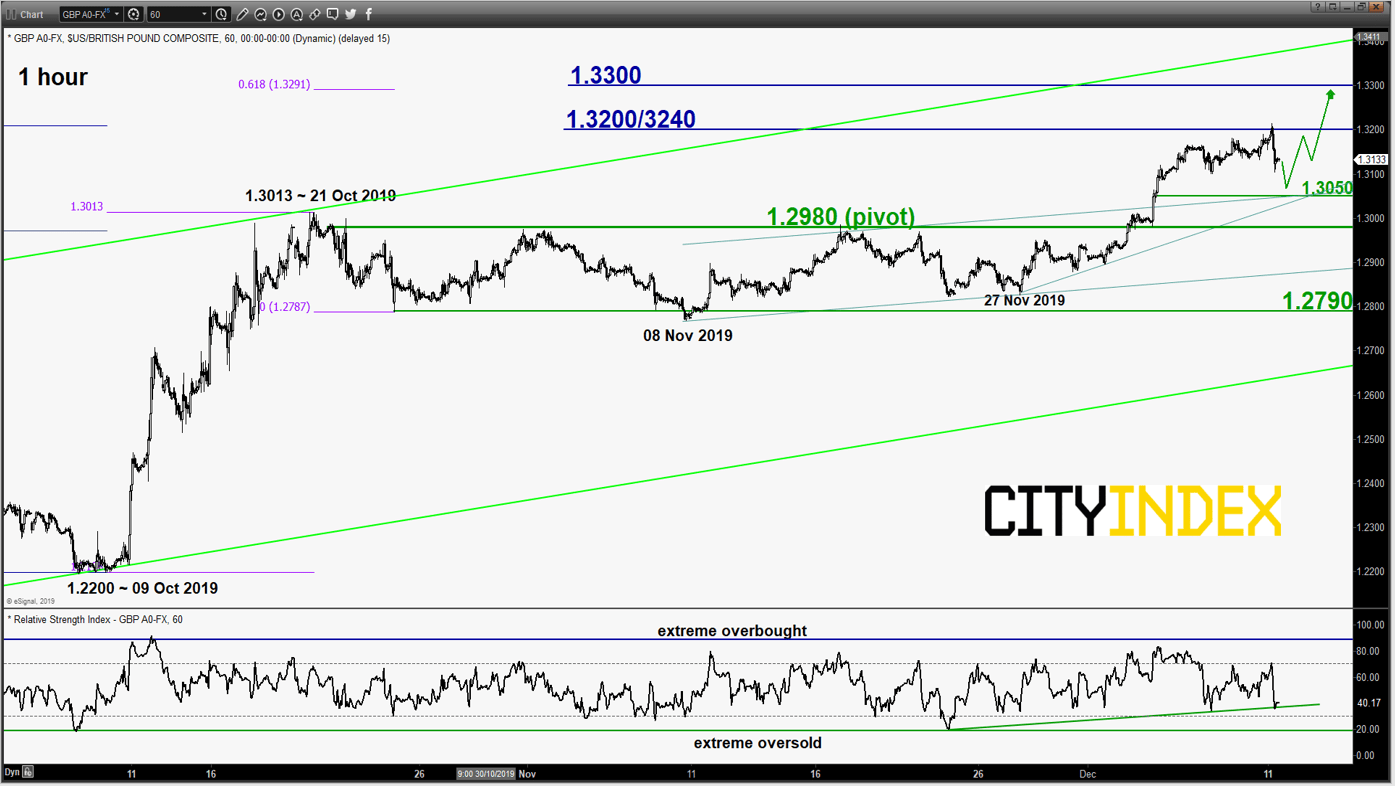
GBP/USD – No clear signs of bullish exhaustion yet
click to enlarge chart
- The pair has continued to inch higher and hit the 1.3200/3240 first resistance/target as per highlighted in our previous report (click here for a recap). Thereafter, it has staged a pull-back of 108 pips in yesterday’s 10 Dec U.S. session after a poll that indicated that PM Boris Johnson’s Conservatives majority has narrowed as we head into the UK General Election on 12 Dec.
- Overall, there is still no clear signs of a bullish exhaustion yet; maintain bullish bias in any dips above the 1.2980 key short-term pivotal support for a further potential push up to target the next resistance at 1.3300 (psychological & Fibonacci expansion cluster).
- On the other hand, a break with an hourly close below 1.2980 negates the bullish tone for a deeper pull-back towards the next support at 1.2790/2750.
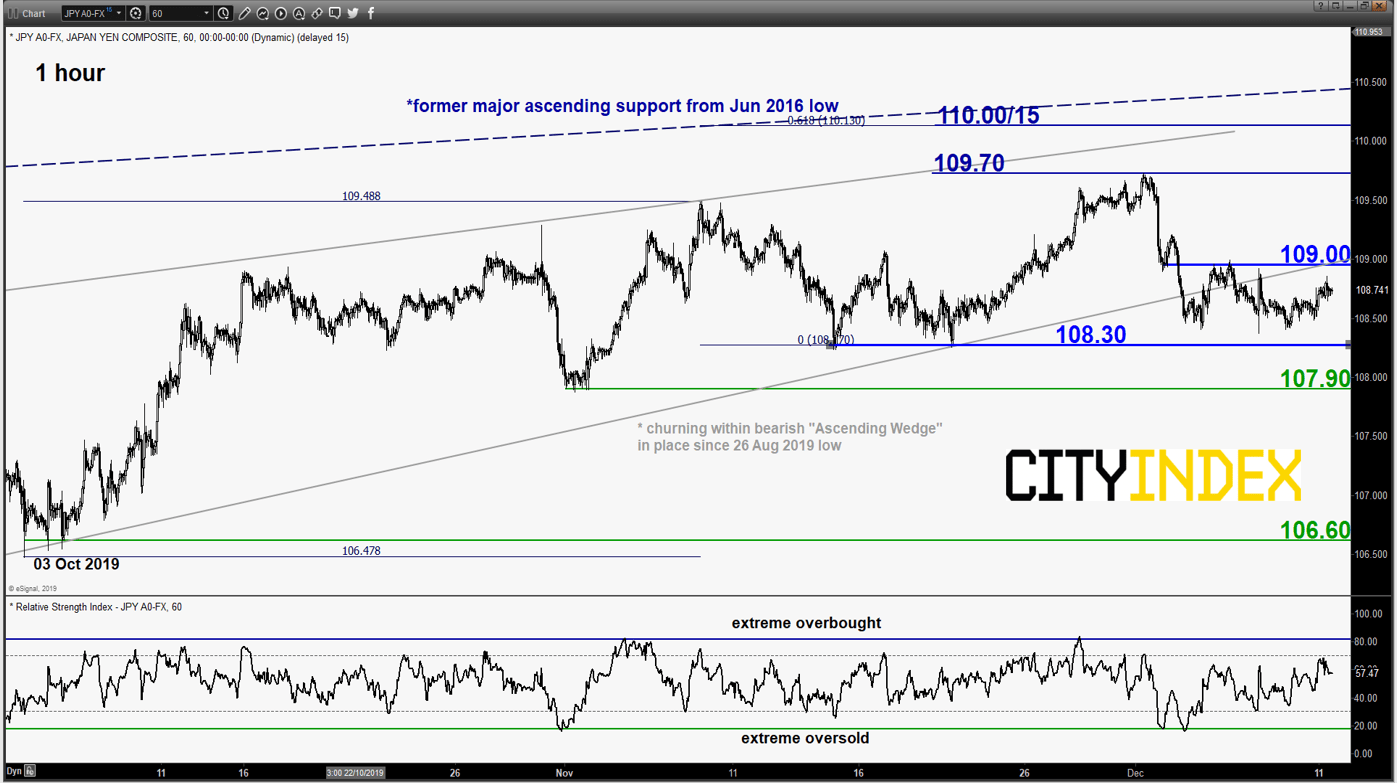
USD/JPY – Stuck within a minor range
click to enlarge chart
- No change, maintain neutrality stance between 109.00 and 108.30. Bears need to have an hourly close below 108.30 for a “clean break down” to target the next supports at 107.90 and 106.60 next.
- On the flipside, a clearance with an hourly close above 109.00 allows the short-term bulls to be in control for a push up towards 109.70 and 110.00/15 next.
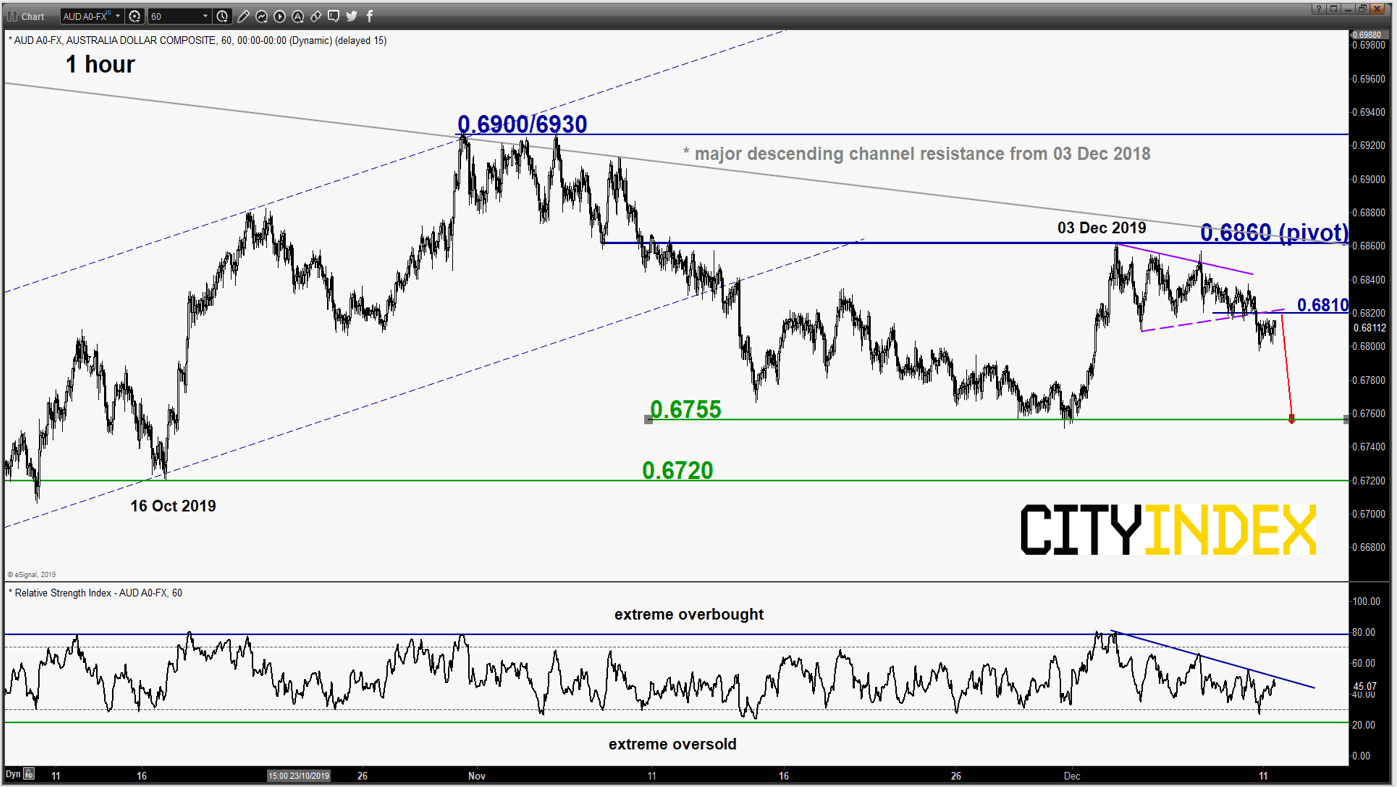
AUD/USD – Minor “Symmetrical Triangle” range bearish breakdown
click to enlarge chart
- The pair has staged a breakdown below the minor “Symmetrical Triangle” range support now turns pull-back resistance at 0.6810.
- Flip to a bearish bias below 0.6860 pivotal resistance (the major descending channel resistance from 03 Dec 2018 high & the 61.8% Fibonacci retracement of the recent slide from 31 Oct high to 29 Nov 2019 low) for a further potential slide to test 0.6755 next.
- On the other hand, a clearance with a daily close above 0.6860 validates a major bullish breakout for an assault towards 0.6900/6930 in the first step.
Charts are from eSignal
StoneX Financial Ltd (trading as “City Index”) is an execution-only service provider. This material, whether or not it states any opinions, is for general information purposes only and it does not take into account your personal circumstances or objectives. This material has been prepared using the thoughts and opinions of the author and these may change. However, City Index does not plan to provide further updates to any material once published and it is not under any obligation to keep this material up to date. This material is short term in nature and may only relate to facts and circumstances existing at a specific time or day. Nothing in this material is (or should be considered to be) financial, investment, legal, tax or other advice and no reliance should be placed on it.
No opinion given in this material constitutes a recommendation by City Index or the author that any particular investment, security, transaction or investment strategy is suitable for any specific person. The material has not been prepared in accordance with legal requirements designed to promote the independence of investment research. Although City Index is not specifically prevented from dealing before providing this material, City Index does not seek to take advantage of the material prior to its dissemination. This material is not intended for distribution to, or use by, any person in any country or jurisdiction where such distribution or use would be contrary to local law or regulation.
For further details see our full non-independent research disclaimer and quarterly summary.
CFDs are complex instruments and come with a high risk of losing money rapidly due to leverage. 69% of retail investor accounts lose money when trading CFDs with this provider. You should consider whether you understand how CFDs work and whether you can afford to take the high risk of losing your money. CFD and Forex Trading are leveraged products and your capital is at risk. They may not be suitable for everyone. Please ensure you fully understand the risks involved by reading our full risk warning.
City Index is a trading name of StoneX Financial Ltd. Head and Registered Office: 1st Floor, Moor House, 120 London Wall, London, EC2Y 5ET. StoneX Financial Ltd is a company registered in England and Wales, number: 05616586. Authorised and regulated by the Financial Conduct Authority. FCA Register Number: 446717.
City Index is a trademark of StoneX Financial Ltd.
The information on this website is not targeted at the general public of any particular country. It is not intended for distribution to residents in any country where such distribution or use would contravene any local law or regulatory requirement.
© City Index 2024