Daily Forex Technical Strategy Tues 27 Aug
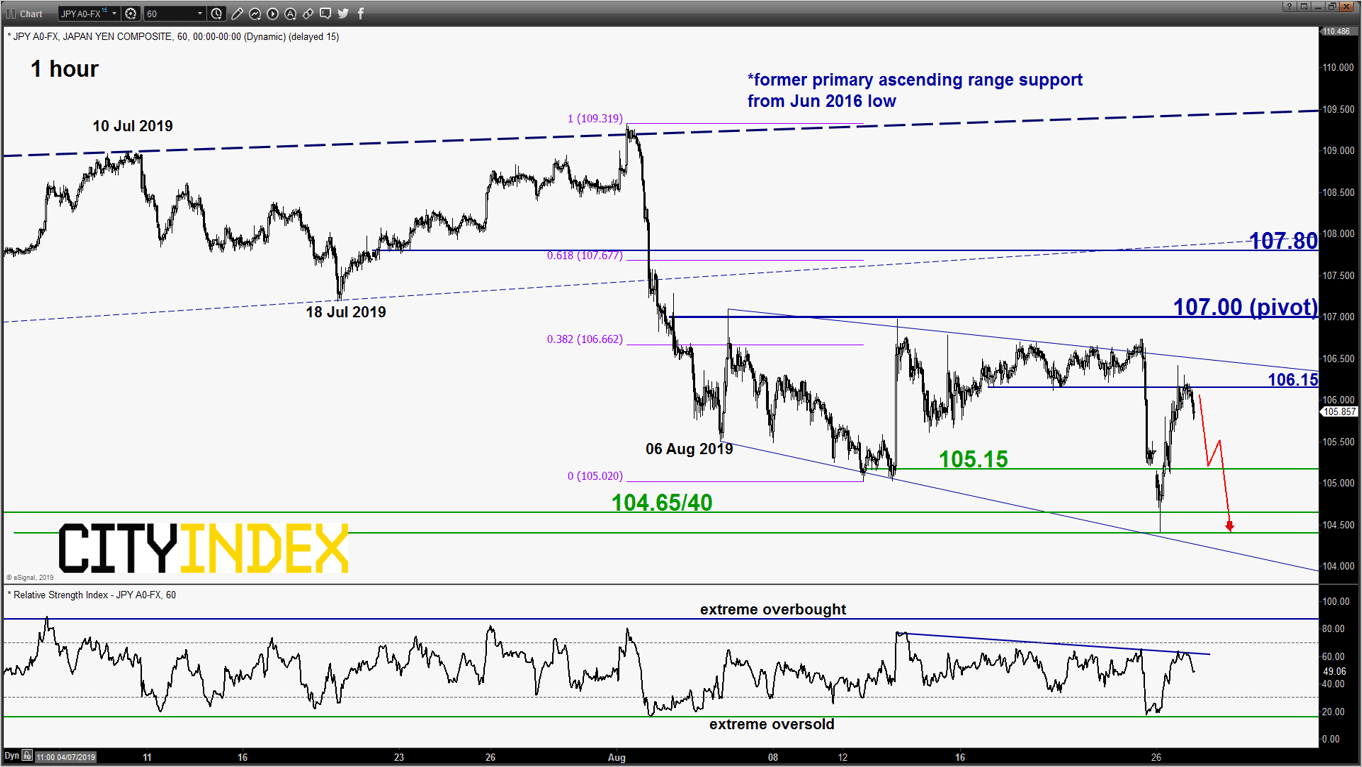
USD/JPY – Potential push back down towards range lower limit
click to enlarge chart
- The pair has staged the expected push down and met the downside target/support of 104.65 yesterday, 26 Aug Asian session (click here to recap our previous report). Thereafter, it has reversed swiftly by 196 pips to print an intraday high of 106.41 on the backdrop of U.S/China trade deal optimism.
- Technical elements are still now showing any clear signs of a major bullish reversal. Also, the 1-hour RSI oscillator has retested a significant corresponding resistance at the 62 level and retreated. Maintain bearish bias in any bounces below 107.00 key short-term pivotal resistance for another round of potential push down towards 105.15 follow by 104.65/40 (lower limit of a complex range configuration in place since 06 Aug 2019). However, a clearance with an hourly close above 107.00 sees an extended corrective rebound towards 107.80 (former ascending range support from 25 Jun 2019 low)
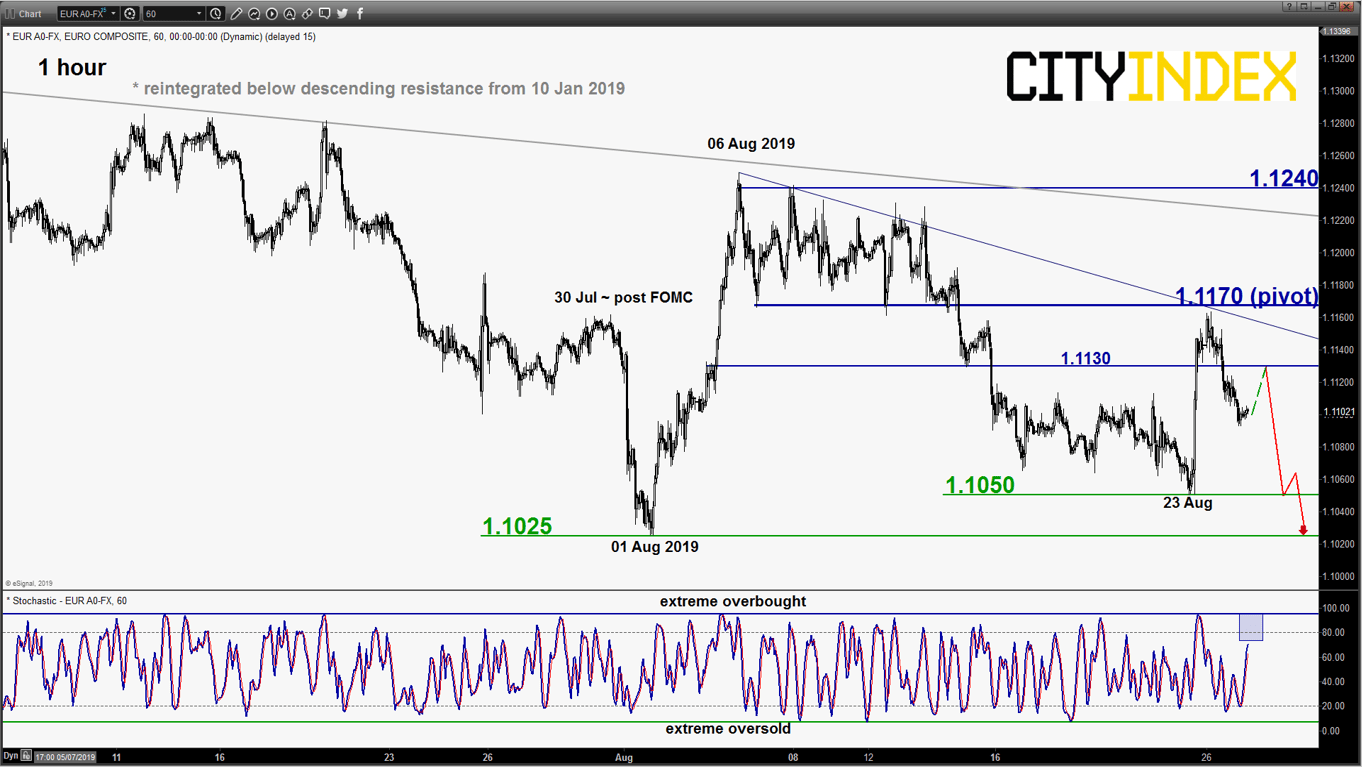
EUR/USD – 1.1170 key short-term resistance to watch
click to enlarge chart
- Last Fri, 23 Aug, the pair has staged a squeeze up above the 1.1115 tightened key short-term resistance and almost reached the alternate target of 1.1170 (the former minor range support & descending trendline from 06 Aug high).
- Thereafter, it has retreated by 70 pips to print a low of 1.1093 in yesterday, 26 Aug U.S. session. It is still evolving within a range configuration since 01 Aug 2019 low, 1.1170 will be the short-term pivotal resistance for a potential push down towards 1.1050 before the 01 Aug 2019 swing low of 1.1025. However, a clearance with an hourly close above 1.1170 negates the bearish tone for an extended corrective rebound towards 1.1240 (06 Aug 2019 swing high area & descending trendline from 10 Jan 2019 high).
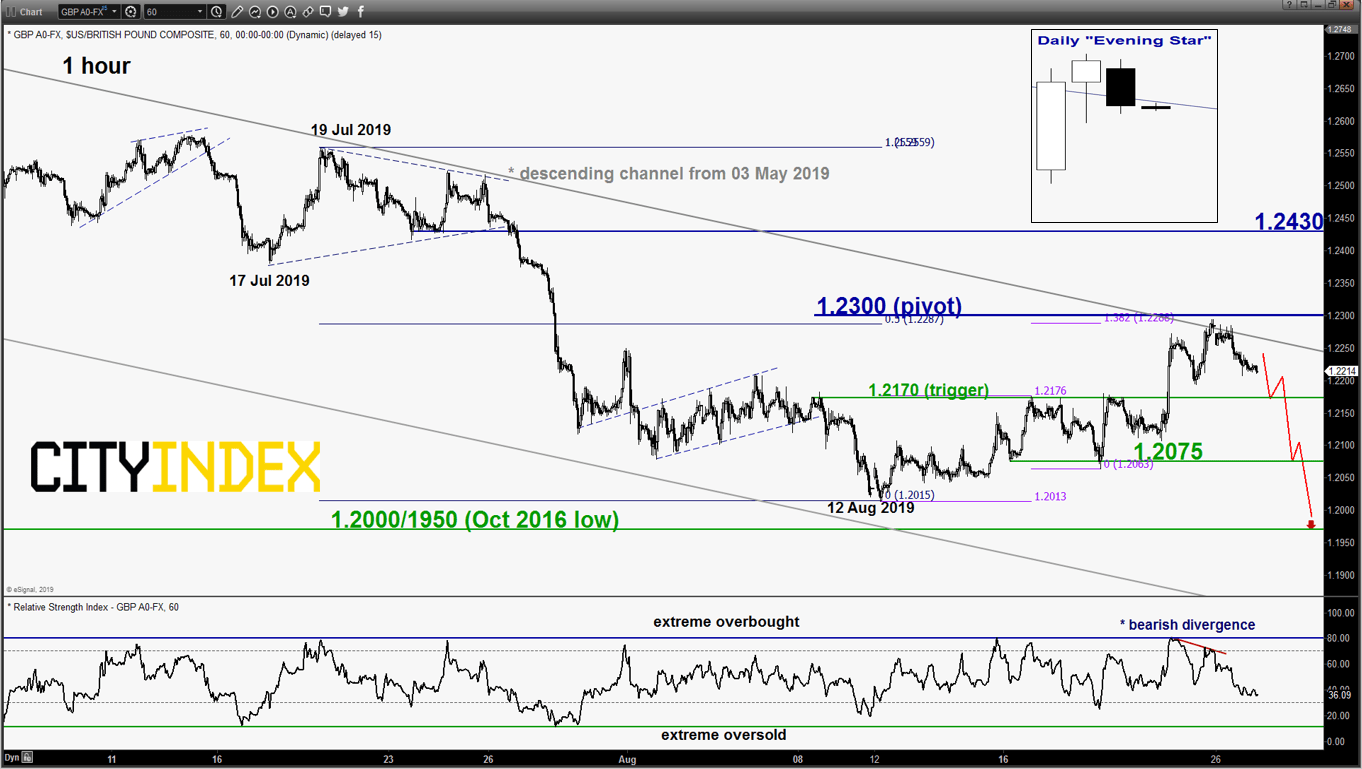
GBP/USD – Retreated from 1.2300 with bearish elements
click to enlarge chart
- The pair has pushed up and staged a retreat right below the 1.2300 upper limit of the short-term neutrality range as per highlighted in our previous report. Bearish elements have emerged, the pair has ended yesterday, 26 Aug U.S. session with a daily “Evening Star” bearish candlestick pattern coupled with a bearish divergence seen in the 1-hour RSI oscillator.
- Flip back to a bearish bias below 1.2300 key short-term pivotal resistance and a break below 1.2170 is likely to reinforce a potential downleg to target 1.2075 and 1.2000/1950 next. However, a clearance with an hourly close above 1.2300 invalidates the bearish scenario for an extended corrective rebound towards the next intermediate resistance at 1.2430.
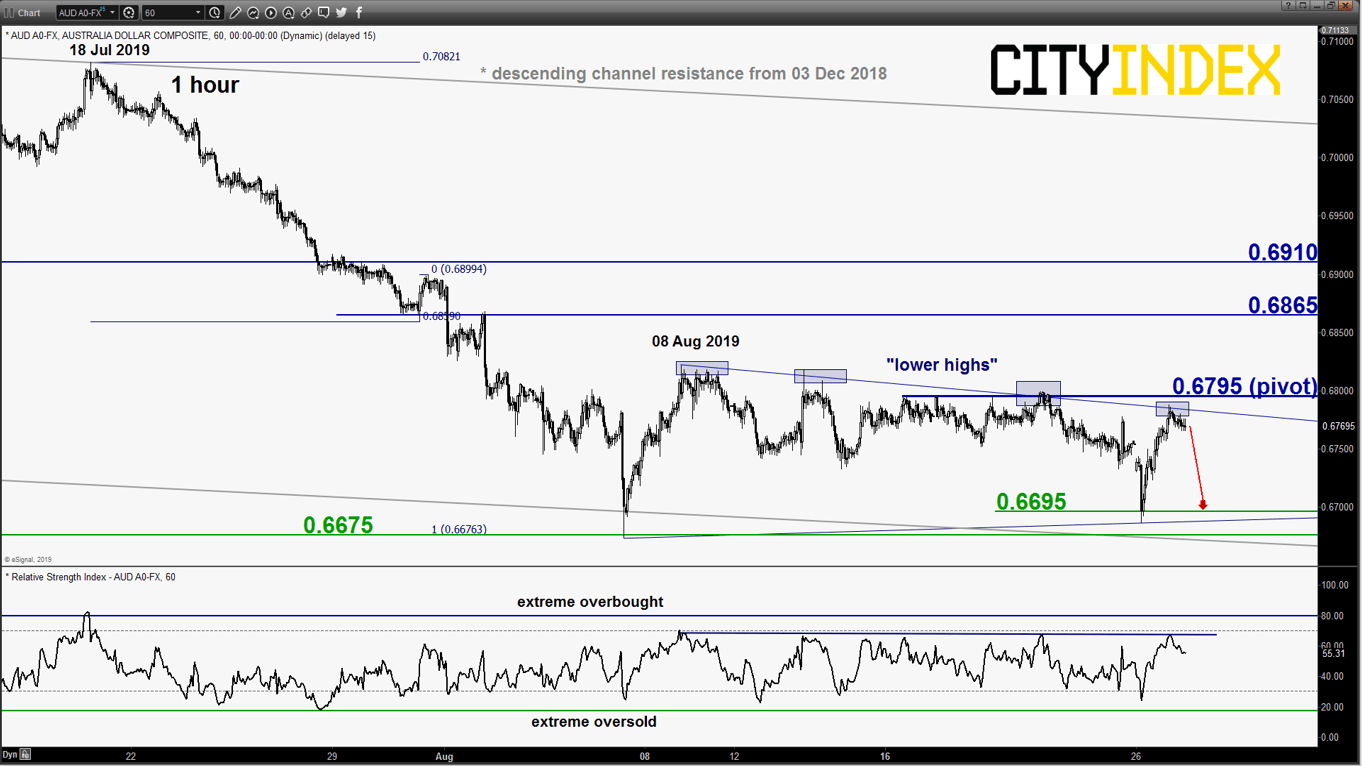
AUD/USD – Potential push down to retest range support
click to enlarge chart
- The pair has staged a push up to retest the upper limit of its minor range configuration in place since 07 Aug 2019 after it hit a minor swing low area of 0.6695 seen yesterday, 26 Aug Asian session.
- Bearish bias below 0.6795 key short-term pivotal resistance for a potential push down to retest the range support zone of 0.6695/6675. However, a break with an hourly close above 0.6795 sees an extension of the corrective rebound towards the next resistance at 0.6865 (also close to the 50% Fibonacci retracement of the recent steep decline from 18 Jul high to 07 Aug 2019 low).
Charts are from eSignal
StoneX Financial Ltd (trading as “City Index”) is an execution-only service provider. This material, whether or not it states any opinions, is for general information purposes only and it does not take into account your personal circumstances or objectives. This material has been prepared using the thoughts and opinions of the author and these may change. However, City Index does not plan to provide further updates to any material once published and it is not under any obligation to keep this material up to date. This material is short term in nature and may only relate to facts and circumstances existing at a specific time or day. Nothing in this material is (or should be considered to be) financial, investment, legal, tax or other advice and no reliance should be placed on it.
No opinion given in this material constitutes a recommendation by City Index or the author that any particular investment, security, transaction or investment strategy is suitable for any specific person. The material has not been prepared in accordance with legal requirements designed to promote the independence of investment research. Although City Index is not specifically prevented from dealing before providing this material, City Index does not seek to take advantage of the material prior to its dissemination. This material is not intended for distribution to, or use by, any person in any country or jurisdiction where such distribution or use would be contrary to local law or regulation.
For further details see our full non-independent research disclaimer and quarterly summary.
CFDs are complex instruments and come with a high risk of losing money rapidly due to leverage. 69% of retail investor accounts lose money when trading CFDs with this provider. You should consider whether you understand how CFDs work and whether you can afford to take the high risk of losing your money. CFD and Forex Trading are leveraged products and your capital is at risk. They may not be suitable for everyone. Please ensure you fully understand the risks involved by reading our full risk warning.
City Index is a trading name of StoneX Financial Ltd. Head and Registered Office: 1st Floor, Moor House, 120 London Wall, London, EC2Y 5ET. StoneX Financial Ltd is a company registered in England and Wales, number: 05616586. Authorised and regulated by the Financial Conduct Authority. FCA Register Number: 446717.
City Index is a trademark of StoneX Financial Ltd.
The information on this website is not targeted at the general public of any particular country. It is not intended for distribution to residents in any country where such distribution or use would contravene any local law or regulatory requirement.
© City Index 2024