Daily Forex Technical Strategy Tues 14 Jan
GBP/USD – Potential rebound around the corner
click to enlarge chart
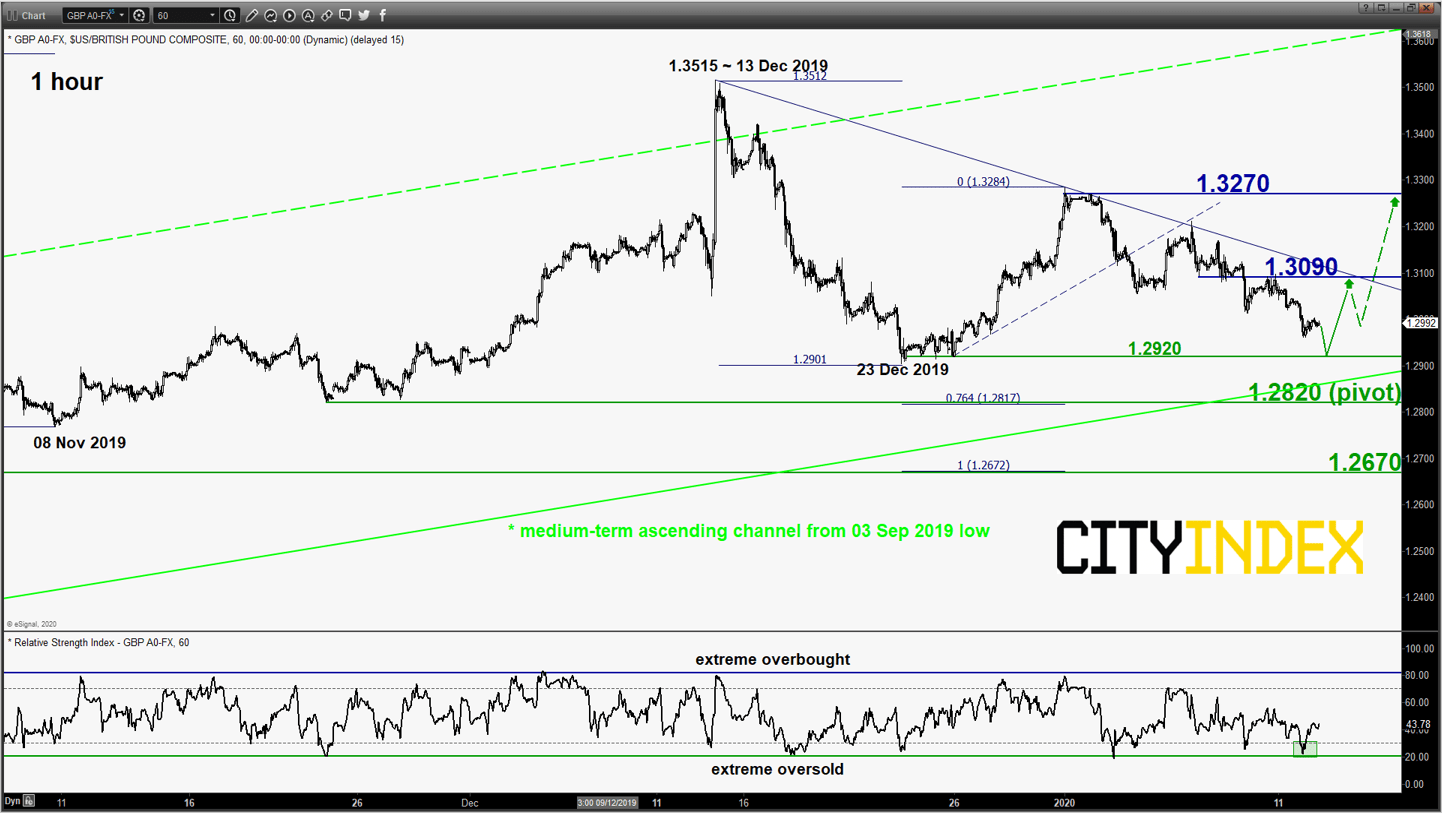
- The pair has staged the push down as expected and almost hit the short-term target/support of 1.2920 as per highlighted in our report (click here for a recap). It printed an intraday low of 1.2959 yesterday, 13 Jan on the backdrop of dovish comments from BOE officials.
- The 300+ pips of decline from the 31 Dec 2019 minor swing high is now approaching the lower boundary of the medium-term ascending channel in place since 03 Sep 2019 low with the hourly RSI oscillator that has tested an extreme oversold level thrice. Flip to a bullish bias with 1.2820 as the key short-term pivotal support for a potential rebound towards 1.3090 (minor congestion zone & descending resistance from 13 Dec 2019 high). An hourly close above 1.3090 reinforces a further potential recovery to target 1.3270 next in the first step.
- On the other hand, a break with an hourly close below 1.2820 opens up scope for a further slide towards the next support at 1.2670/2560 (1.00 Fibonacci expansion of the recent decline from 13 Dec 2019 high & 61.8% Fibonacci retracement of the multi-month up move from 03 Sep 2019 low to 13 Dec 2019 high).
EUR/USD – Potential bullish breakout above 1.1160
click to enlarge chart
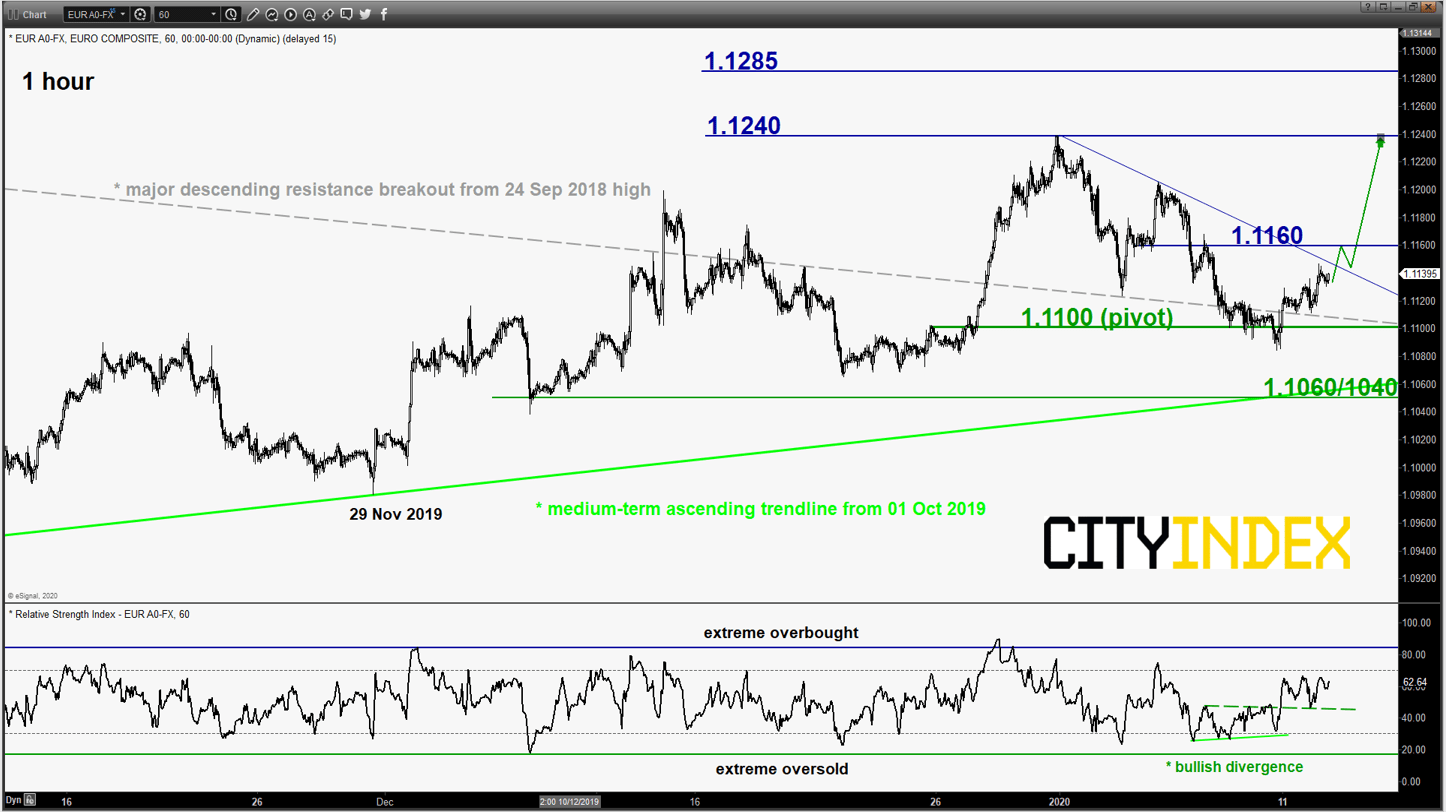
- The pair has started to shape a rebound of 60 pips from the 1.1100 lower limit of the short-term neutrality zone as per highlighted in our previous report; also the pull-back support of the former major descending resistance from 24 Sep 2018 high.
- Elements have turned positive; flip to a bullish bias with 1.1100 as the key short-term pivotal support and a break with an hourly close above 1.1160 reinforces the potential recovery to retest the 31 Dec 2019 swing high of 1.1240.
- On the other hand, a break with an hourly close below 1.1100 invalidates the bullish scenario for a further slide towards 1.1060/1040 (medium-term ascending trendline from 01 Oct 2019 low).
USD/JPY – Further potential residual push up towards major resistance
click to enlarge chart
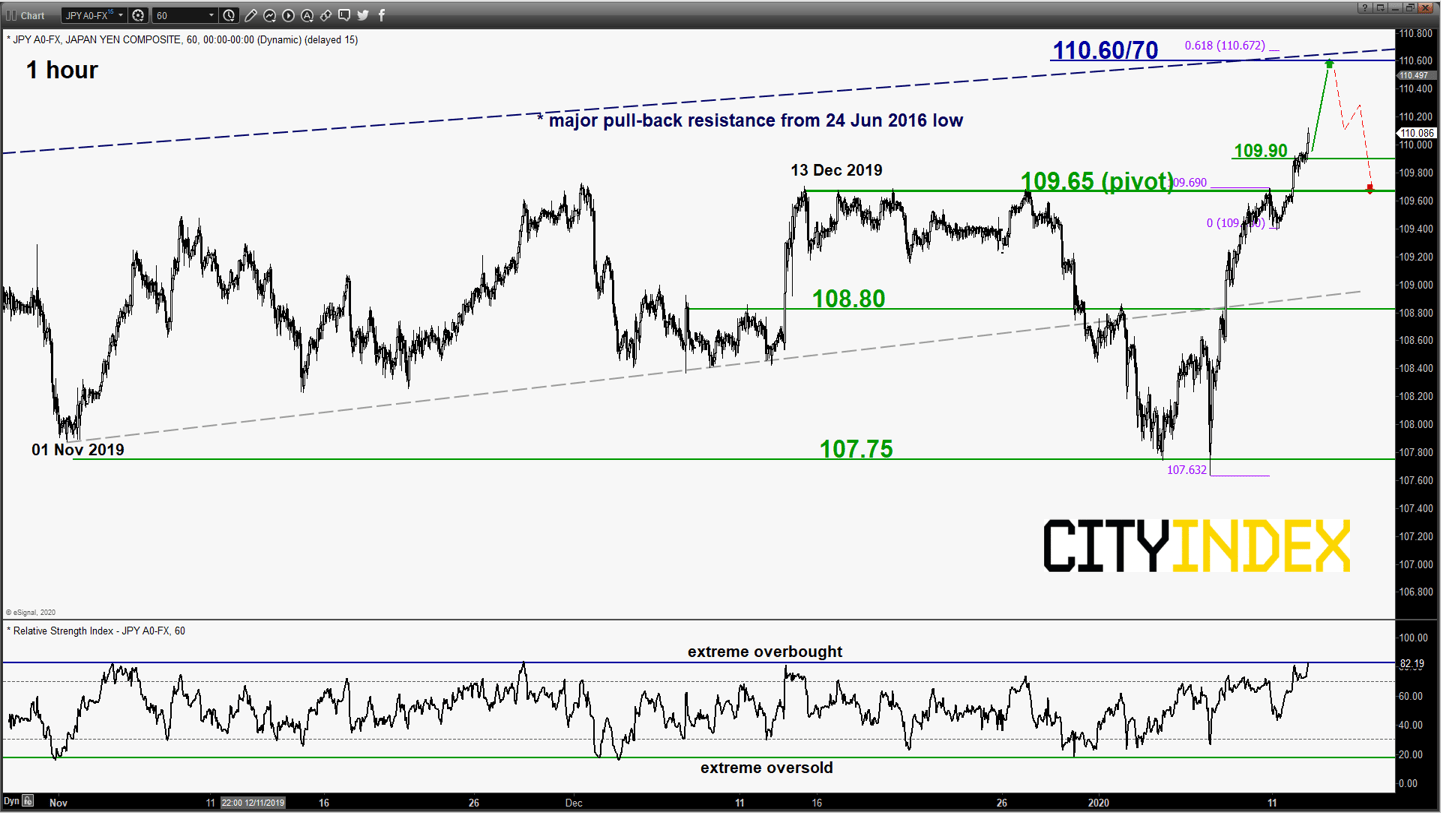
- The pair has broken above the 109.70 minor range resistance in place since 13 Dec 2019 (the upper neutrality zone as per highlighted in our previous report). Flip to bullish bias now in any dips above 109.65 key short-term pivotal support for a further potential residual push up to target the major resistance at 1110.60/70 (former ascending support from 24 Jun 2016 low, 21 May 2019 swing high, secular descending resistance from 05 Jun 2015 high & a Fibonacci expansion/retracement cluster) before a corrective decline materialises.
- On the other hand, a break with an hourly close below 109.65 invalidates the residual push up scenario for a corrective decline towards the 108.80 near-term support in the first step.
AUD/USD – Mix elements intact
click to enlarge chart
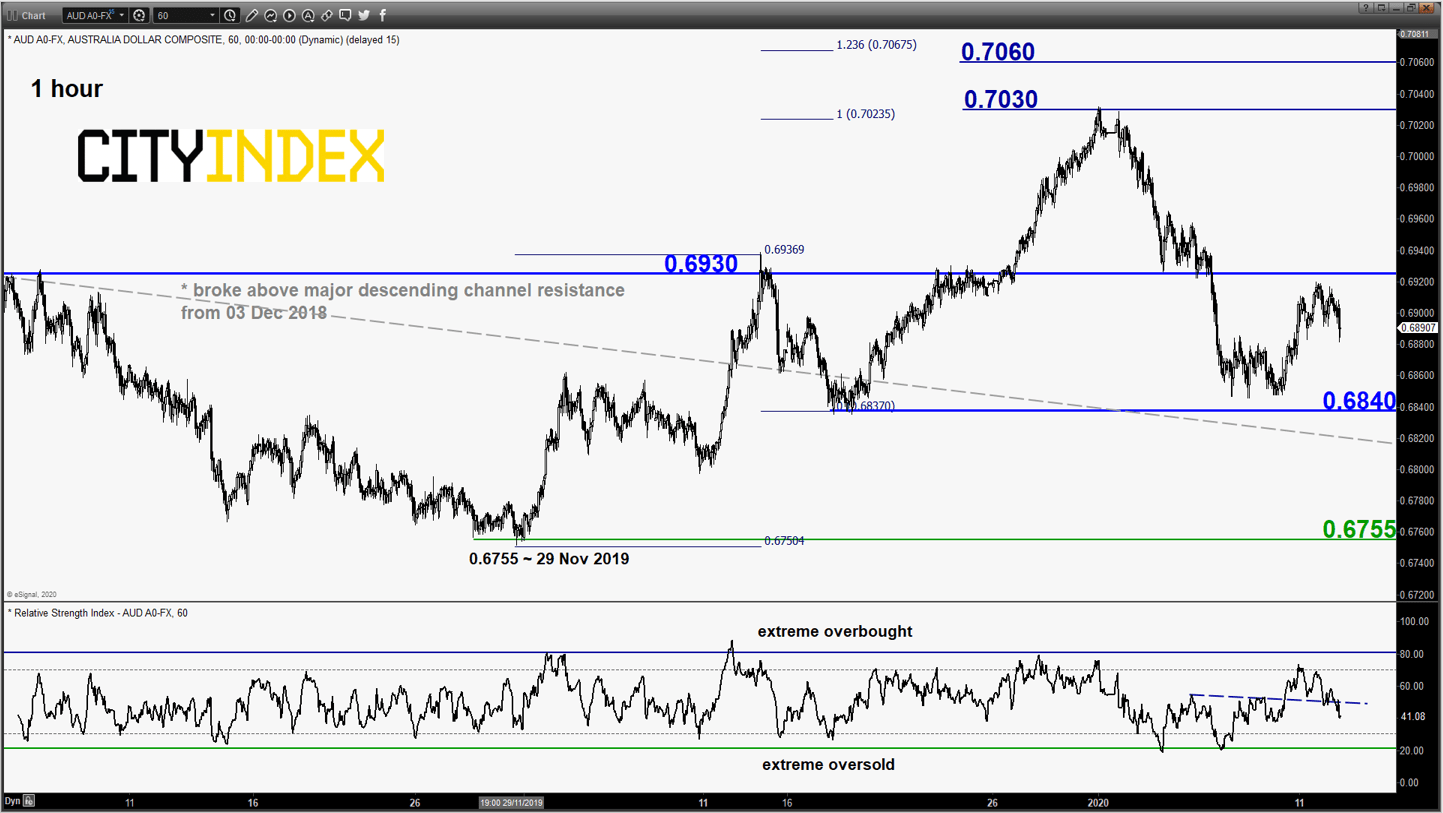
- No change; maintain neutrality stance between 0.6930 and 0.6840 (also the pull-back support of the former major descending channel resistance from 03 Dec 2018 high).
- Only a clearance with an hourly close above 0.6930 revives the bullish tone for push up to retest 0.7030 before targeting 0.7060/7080. On the flipside, a break with an hourly close below 0.6840 sees a further slide to probe the 0.6755 major support (the ascending trendline from 07 Aug 2019 low).
Charts are from eSignal
StoneX Financial Ltd (trading as “City Index”) is an execution-only service provider. This material, whether or not it states any opinions, is for general information purposes only and it does not take into account your personal circumstances or objectives. This material has been prepared using the thoughts and opinions of the author and these may change. However, City Index does not plan to provide further updates to any material once published and it is not under any obligation to keep this material up to date. This material is short term in nature and may only relate to facts and circumstances existing at a specific time or day. Nothing in this material is (or should be considered to be) financial, investment, legal, tax or other advice and no reliance should be placed on it.
No opinion given in this material constitutes a recommendation by City Index or the author that any particular investment, security, transaction or investment strategy is suitable for any specific person. The material has not been prepared in accordance with legal requirements designed to promote the independence of investment research. Although City Index is not specifically prevented from dealing before providing this material, City Index does not seek to take advantage of the material prior to its dissemination. This material is not intended for distribution to, or use by, any person in any country or jurisdiction where such distribution or use would be contrary to local law or regulation.
For further details see our full non-independent research disclaimer and quarterly summary.
CFDs are complex instruments and come with a high risk of losing money rapidly due to leverage. 69% of retail investor accounts lose money when trading CFDs with this provider. You should consider whether you understand how CFDs work and whether you can afford to take the high risk of losing your money. CFD and Forex Trading are leveraged products and your capital is at risk. They may not be suitable for everyone. Please ensure you fully understand the risks involved by reading our full risk warning.
City Index is a trading name of StoneX Financial Ltd. Head and Registered Office: 1st Floor, Moor House, 120 London Wall, London, EC2Y 5ET. StoneX Financial Ltd is a company registered in England and Wales, number: 05616586. Authorised and regulated by the Financial Conduct Authority. FCA Register Number: 446717.
City Index is a trademark of StoneX Financial Ltd.
The information on this website is not targeted at the general public of any particular country. It is not intended for distribution to residents in any country where such distribution or use would contravene any local law or regulatory requirement.
© City Index 2024