Daily Forex Technical Strategy Tues 03 Dec
EUR/USD – Sideways
click to enlarge chart
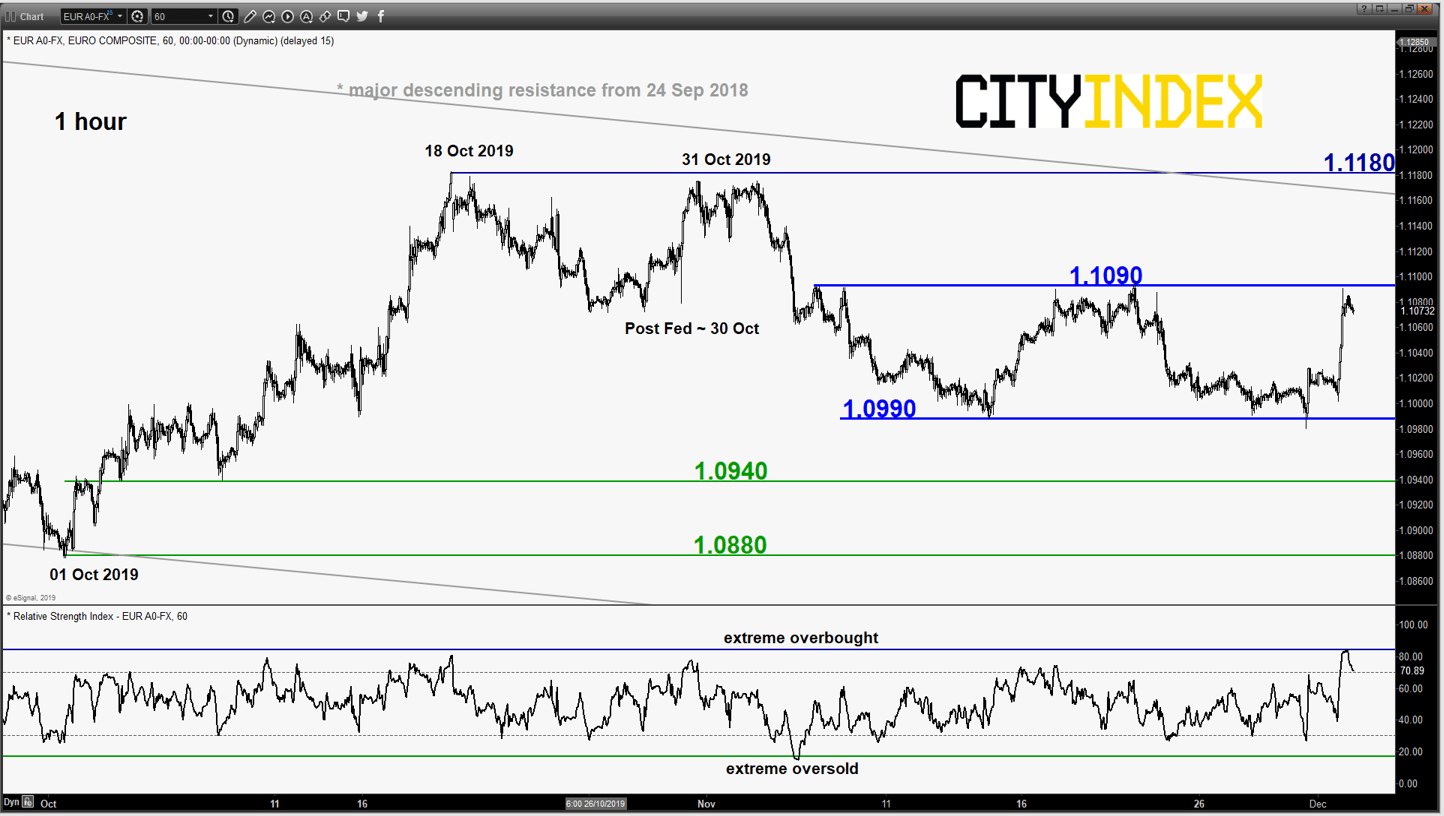
- The pair has inched down lower to test the 14 Nov 2019 minor swing low of 1.0990 before it rebounded back towards the minor range resistance of 1.1090 in place since 06 Nov 2019.
- The hourly RSI oscillator has started to inch down from an extreme overbought level which indicates that yesterday’s push up reinforced by U.S. President Trump’s tweets on reinstating steel tariffs on Brazil and Argentina imports and a weaker ISM manufacturing PMI for Oct is likely to be overextended. Thus, it may see a push down to retest 1.0990.
- Since it is trading within a minor range configuration in the middle of a major descending resistance from 24 Sep 2018 high, prefer to turn neutral now between 1.1090 and 1.0990. A clearance above 1.1090 sees a push up towards the 1.1180 major descending resistance while a break with an hourly close below 1.0990 resumes the potential down move towards 1.0940 follow by 1.0880.
GBP/USD – Back at minor range resistance
click to enlarge chart
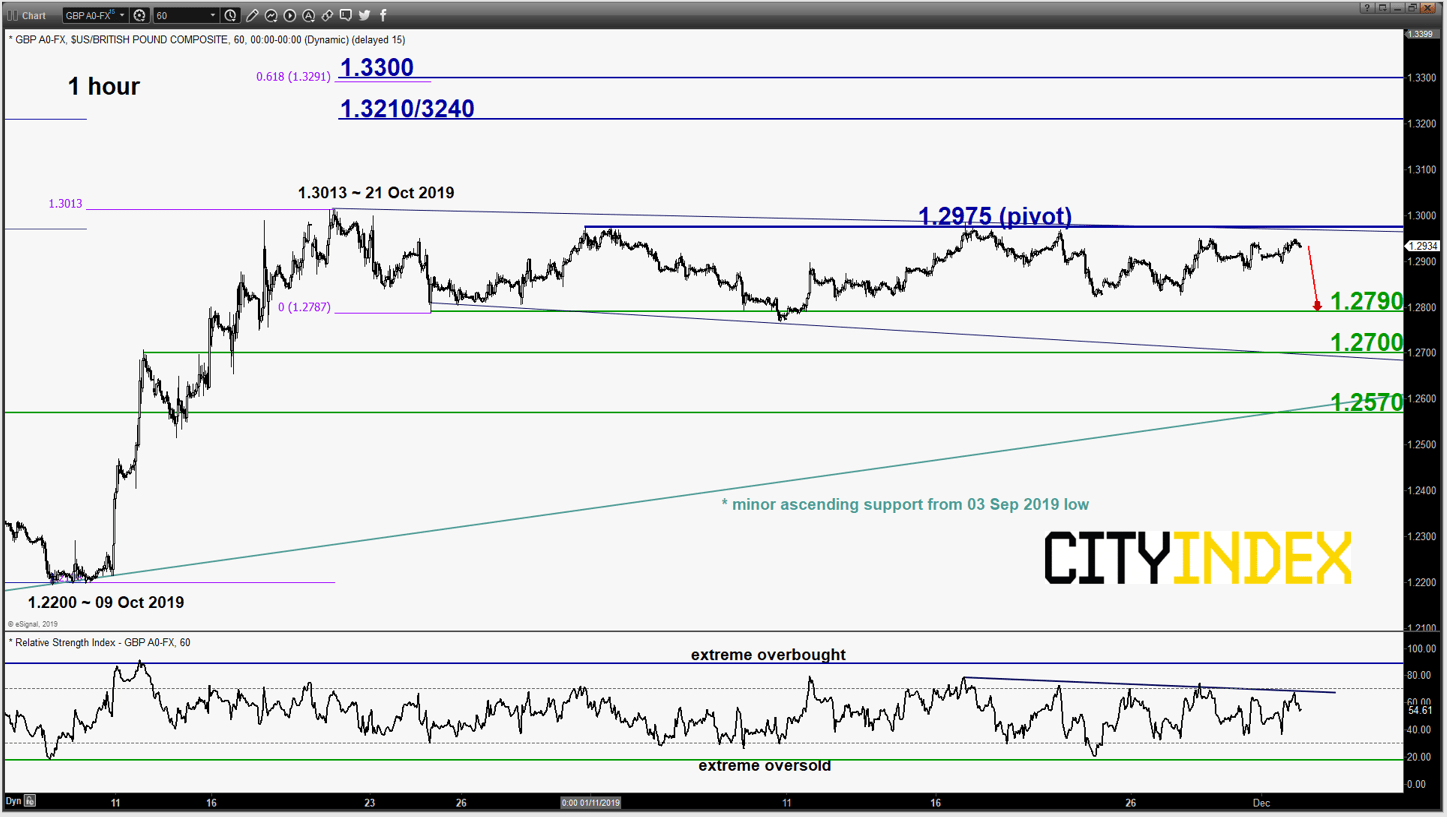
- The pair has continued to evolve within a minor “Expanding Wedge”/sideways range configuration in place since 21 Oct 2019 high with its hourly RSI oscillator that has just retreated from its overbought region and a corresponding resistance that is in parallel with the “Expanding Wedge” resistance at 1.2975.
- Maintain bearish bias below 1.2975 key short-term pivotal resistance for a potential push down to retest the minor range support/lower boundary of the “Expanding Wedge” at 1.2790. On the other hand, a break with an hourly close above 1.2975 revives the bullish tone for another round of impulsive upleg sequence to target the next intermediate resistance at 1.3210/3240 (3 Apr/03 May 2019 swing high area & Fibonacci expansion).
USD/JPY – Potential final push up towards “Ascending Wedge” top
click to enlarge chart
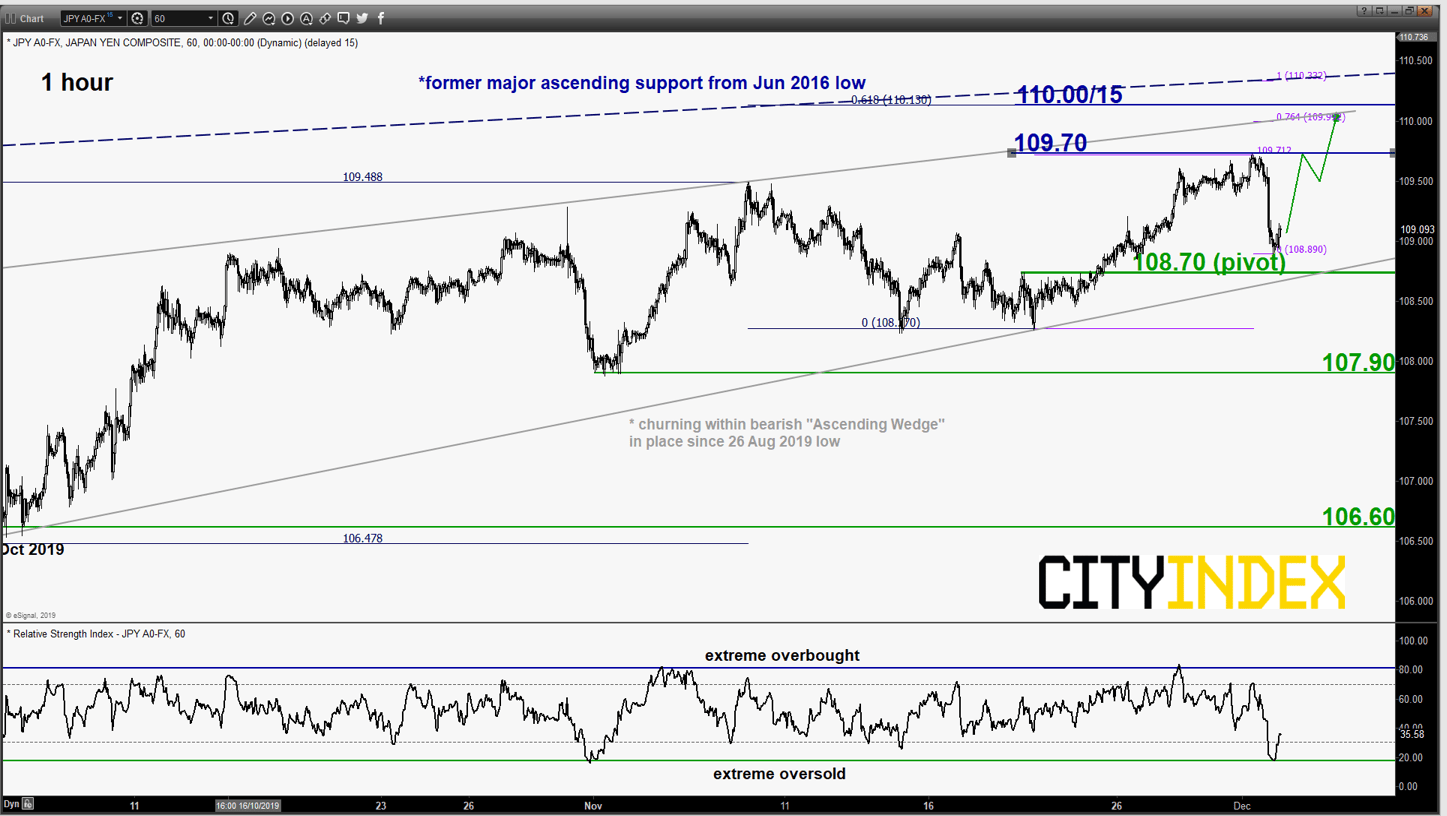
- Yesterday’s slide from its recent minor swing high of 109.70 printed on 02 Dec has managed to stall just above the lower boundary of the minor bearish “Ascending Wedge” now acting as a support at 108.70 with the hourly RSI oscillator that has just rebounded from an extreme oversold level.
- 108.70 key short-term pivotal support for a potential final push up to retest 109.70 before targeting the “Ascending Wedge” top/resistance at 110.00/15. On the other hand, a break with an hourly close below 108.70 shall trigger a bearish breakdown from the “Ascending Wedge” to kickstart a potential multi-week corrective down move towards the next near-term support at 107.90 in the first step.
AUD/USD – 0.6845 key minor resistance ahead of RBA
click to enlarge chart
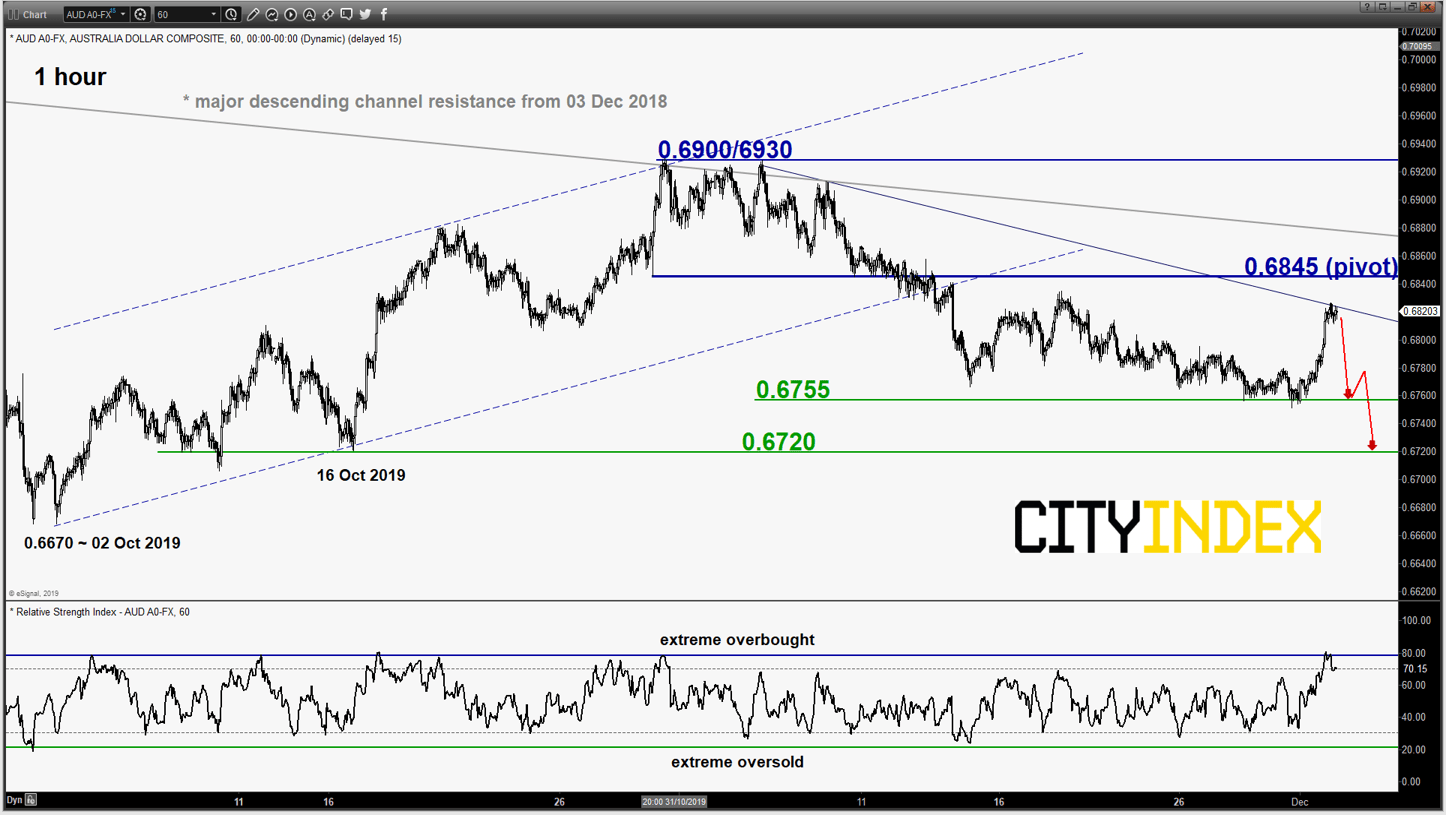
- The pair has staged a push up from the 28/29 Nov 2019 minor swing low area of 0.6755 before it stalled at the minor descending trendline resistance from 05 Nov 2019 high and the 38.2% Fibonacci retracement of recent slide from 31 Oct high to 29 Nov 2019 low.
- In addition, the hourly RSI oscillator has started to retreat from an extreme overbought level. Maintain bearish bias below 0.6845 key short-term pivotal resistance for another potential push down to retest 0.6755 and below exposes 0.6720 next (09/16 Oct 2019 swing low areas).
- On the other hand, a clearance with an hourly close above 0.6845 negates the bearish tone for squeeze up to retest 0.6900/6930 (31 Oct/05 Nov 2019 swing high & the major descending channel resistance from 03 Dec 2018 high).
Charts are from eSignal
StoneX Financial Ltd (trading as “City Index”) is an execution-only service provider. This material, whether or not it states any opinions, is for general information purposes only and it does not take into account your personal circumstances or objectives. This material has been prepared using the thoughts and opinions of the author and these may change. However, City Index does not plan to provide further updates to any material once published and it is not under any obligation to keep this material up to date. This material is short term in nature and may only relate to facts and circumstances existing at a specific time or day. Nothing in this material is (or should be considered to be) financial, investment, legal, tax or other advice and no reliance should be placed on it.
No opinion given in this material constitutes a recommendation by City Index or the author that any particular investment, security, transaction or investment strategy is suitable for any specific person. The material has not been prepared in accordance with legal requirements designed to promote the independence of investment research. Although City Index is not specifically prevented from dealing before providing this material, City Index does not seek to take advantage of the material prior to its dissemination. This material is not intended for distribution to, or use by, any person in any country or jurisdiction where such distribution or use would be contrary to local law or regulation.
For further details see our full non-independent research disclaimer and quarterly summary.
CFDs are complex instruments and come with a high risk of losing money rapidly due to leverage. 69% of retail investor accounts lose money when trading CFDs with this provider. You should consider whether you understand how CFDs work and whether you can afford to take the high risk of losing your money. CFD and Forex Trading are leveraged products and your capital is at risk. They may not be suitable for everyone. Please ensure you fully understand the risks involved by reading our full risk warning.
City Index is a trading name of StoneX Financial Ltd. Head and Registered Office: 1st Floor, Moor House, 120 London Wall, London, EC2Y 5ET. StoneX Financial Ltd is a company registered in England and Wales, number: 05616586. Authorised and regulated by the Financial Conduct Authority. FCA Register Number: 446717.
City Index is a trademark of StoneX Financial Ltd.
The information on this website is not targeted at the general public of any particular country. It is not intended for distribution to residents in any country where such distribution or use would contravene any local law or regulatory requirement.
© City Index 2024