Daily Forex Technical Strategy Thurs 08 Aug
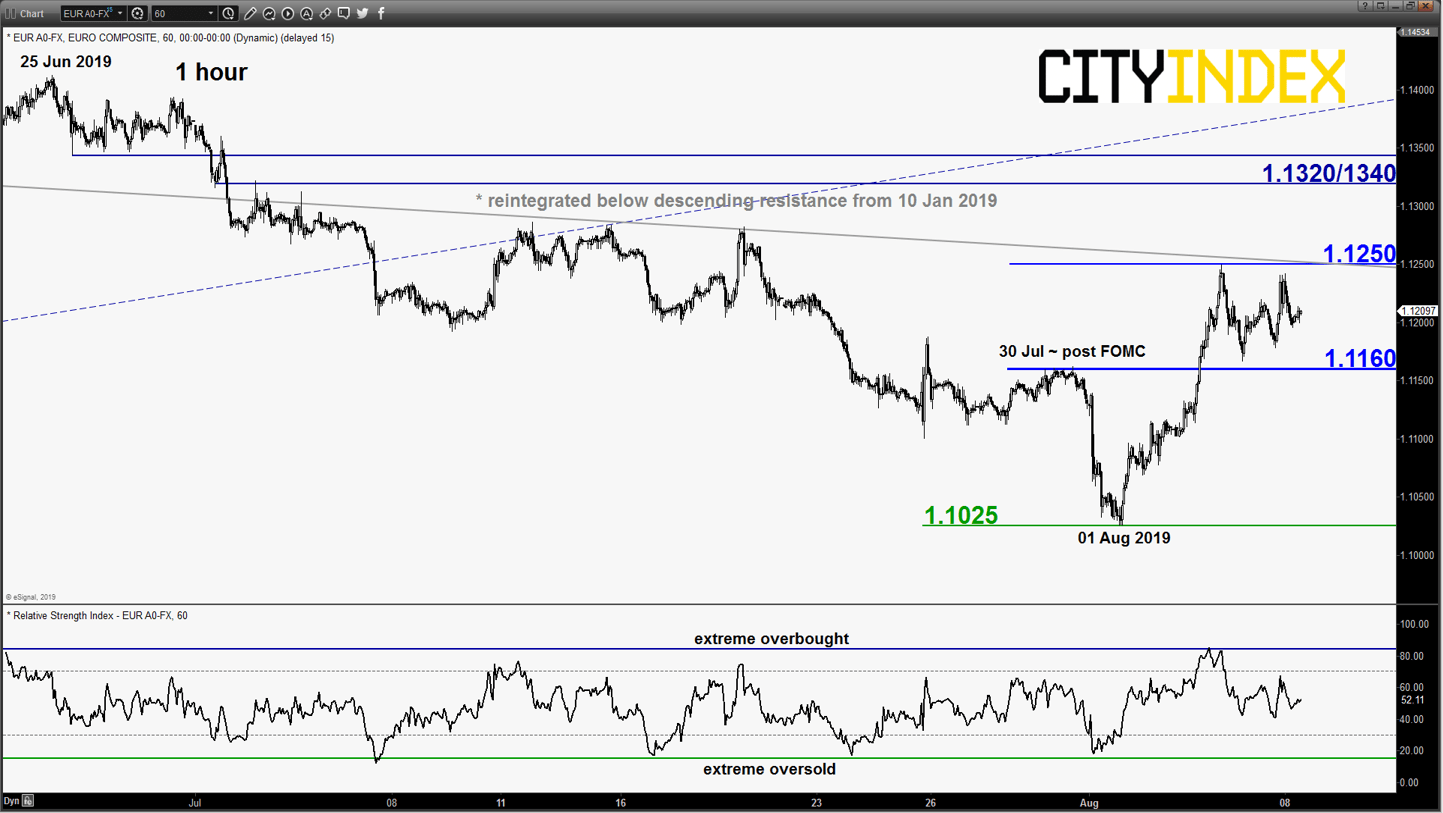
EUR/USD – Sideways
click to enlarge chart
- Traded sideways within the short-term neutrality zone as per highlighted in our previous report (click here for a recap).
- No change, maintain neutral stance between 1.1250 and 1.1160. Only an hourly close below 1.1160 reignites the bearish tone for a push down to retest 1.1025. On the flipside, an hourly close above 1.1250 sees an extended corrective rebound towards the next resistance at 1.1320/1340.
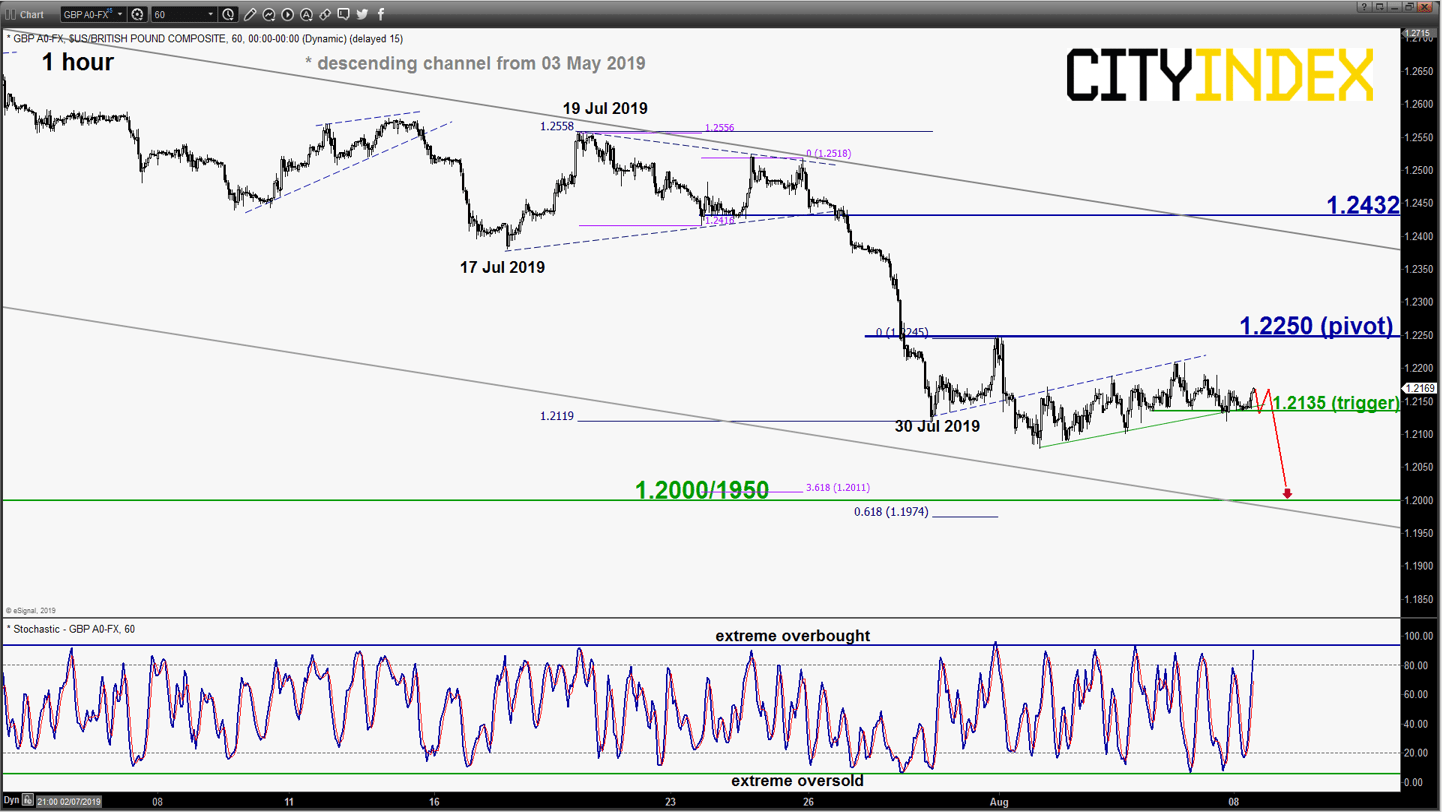
GBP/USD – 1.2135 needs to be broken to the downside
click to enlarge chart
- Tested the 1.2135 downside trigger level as per highlighted in our previous report and traded sideways. Maintain bearish bias and 1.2135 needs to be broken to the downside to reinforce the downleg scenario to target the next near-term support at 1.2000/1950 (Fibonacci projection cluster & Oct 2016 low).
- On the other hand, a clearance with an hourly close above 1.2250 negates the bearish tone for an extension of the corrective rebound towards the 1.2430 resistance.
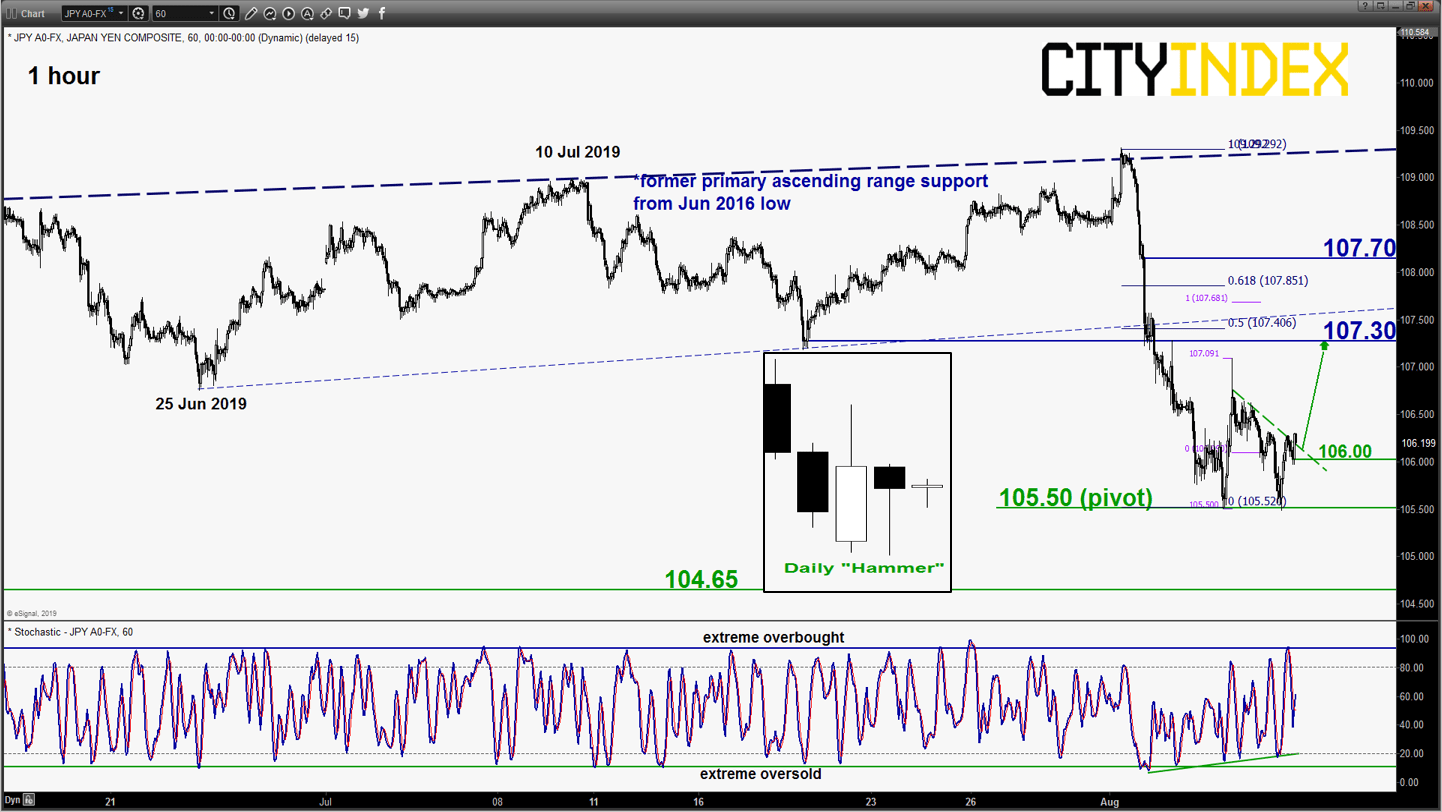
USD/JPY – 105.50 remains the key support to watch
click to enlarge chart
- Tested the 105.50 key short-term pivotal support and rebounded. In addition, it ended yesterday’s 07 Aug U.S. session with a daily bullish “Hammer” candlestick pattern
- Maintain bullish bias with another leg of corrective rebound to target the 107.30 intermediate resistance (former minor ascending support from 25 Jun 2019 low & Fibonacci retracement/projection cluster).
- On the other hand, a break with an hourly close below 105.50 revives the impulsive down move sequence towards 104.65 (close to 03 Jan 2019 flash crash low & 23 Mar 2018 swing low).
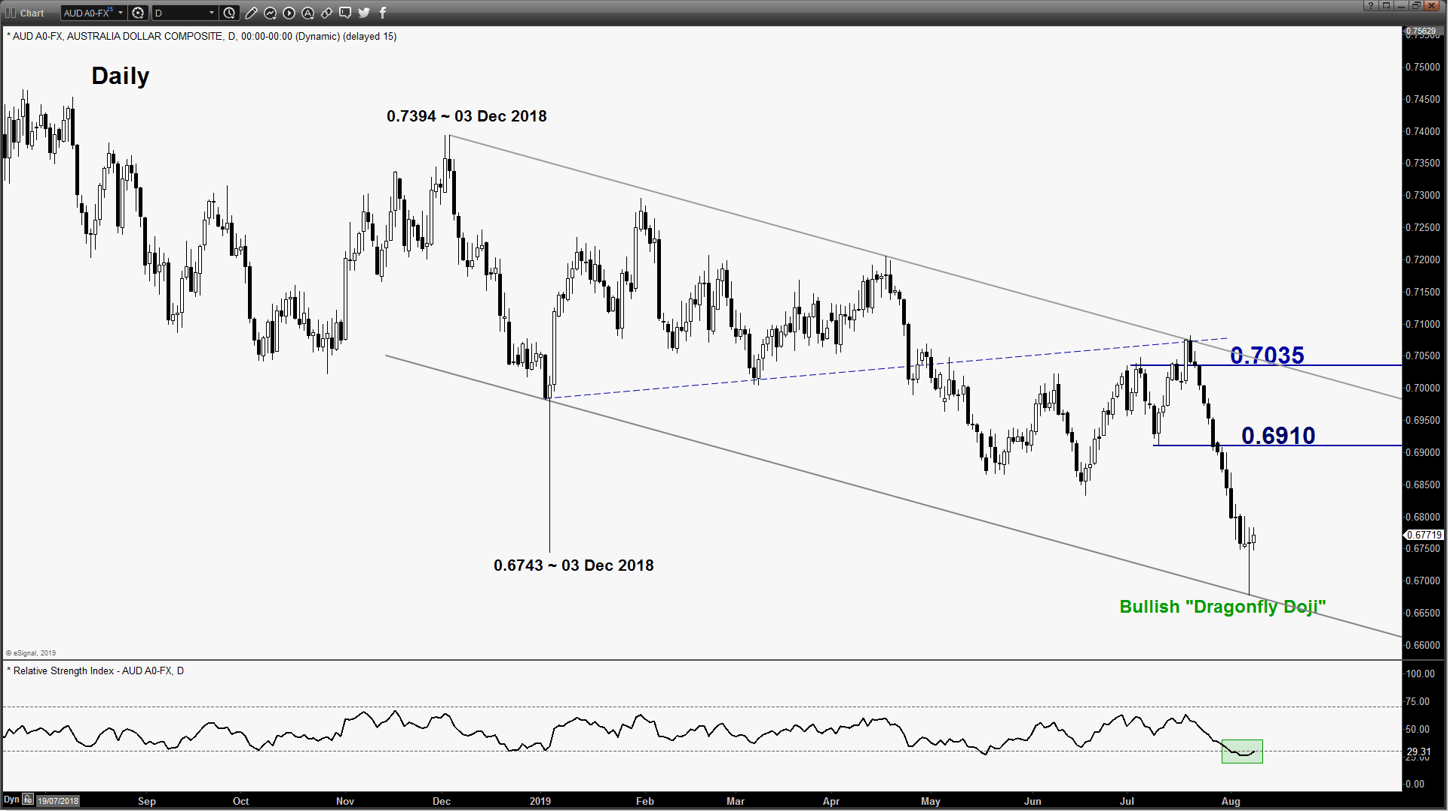
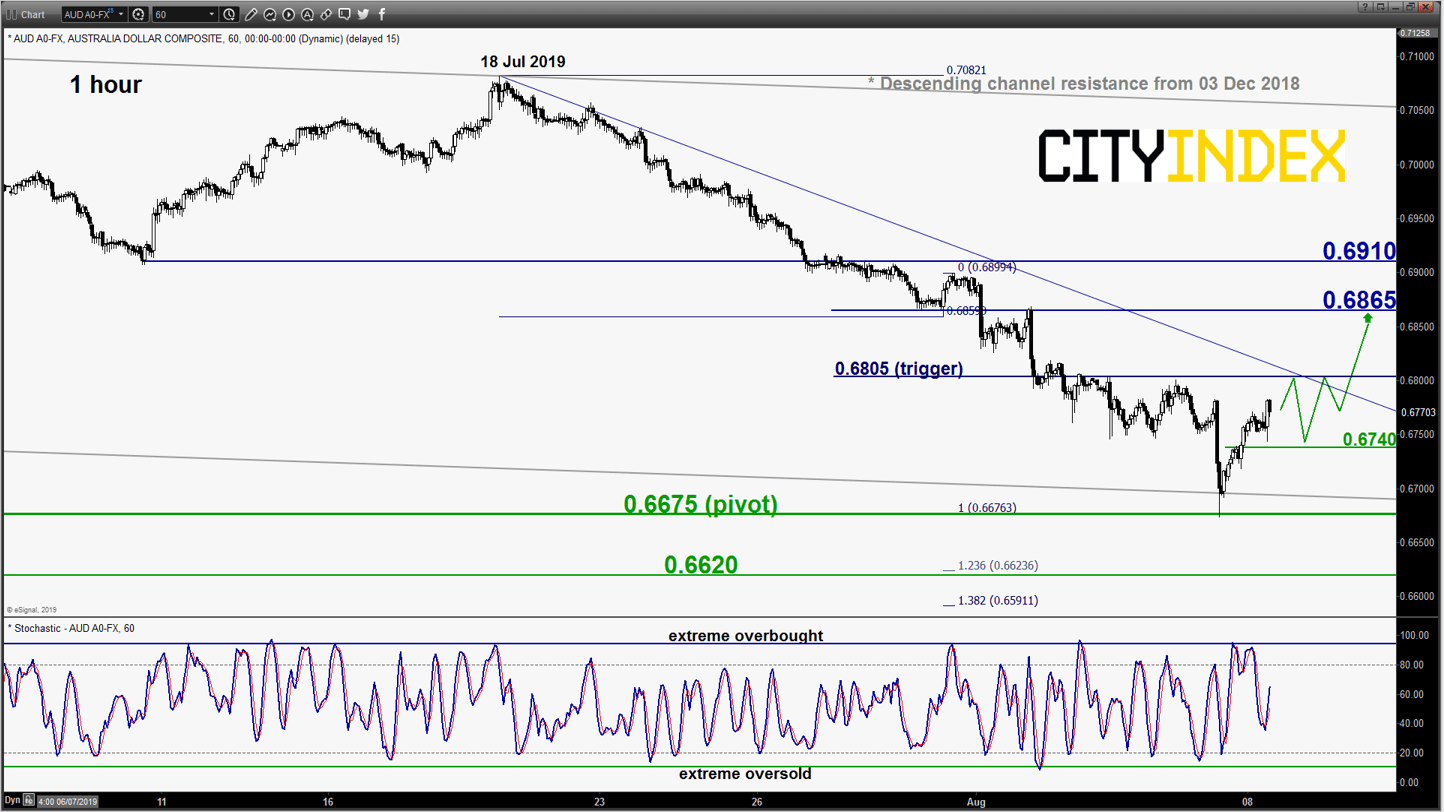
AUD/USD – Potential mean reversion rebound
click to enlarge charts
- Drifted down lower as expected but it only managed to hit the first short-term downside target/support at 0.6675 before it reversed up. Broke above the 0.6755 key short-term pivotal resistance as per highlighted in our previous report that has dampened the bearish outlook for another leg down.
- Ended yesterday, 07 Aug U.S. session with a daily bullish “Dragonfly Doji” candlestick pattern right at the medium-term descending channel support coupled with the daily RSI oscillator that is inching up from its oversold region. These observations suggest that a potential mean reversion rebound scenario.
- Flip to a bullish bias above the 0.6675 key short-term pivotal support and a break above 0.6805 reinforces a mean reversion corrective rebound to target the next intermediate resistance at 0.6865. On the other hand, a break with an hourly close below 0.6675 revives the bears for a push down towards 0.6620 next.
StoneX Financial Ltd (trading as “City Index”) is an execution-only service provider. This material, whether or not it states any opinions, is for general information purposes only and it does not take into account your personal circumstances or objectives. This material has been prepared using the thoughts and opinions of the author and these may change. However, City Index does not plan to provide further updates to any material once published and it is not under any obligation to keep this material up to date. This material is short term in nature and may only relate to facts and circumstances existing at a specific time or day. Nothing in this material is (or should be considered to be) financial, investment, legal, tax or other advice and no reliance should be placed on it.
No opinion given in this material constitutes a recommendation by City Index or the author that any particular investment, security, transaction or investment strategy is suitable for any specific person. The material has not been prepared in accordance with legal requirements designed to promote the independence of investment research. Although City Index is not specifically prevented from dealing before providing this material, City Index does not seek to take advantage of the material prior to its dissemination. This material is not intended for distribution to, or use by, any person in any country or jurisdiction where such distribution or use would be contrary to local law or regulation.
For further details see our full non-independent research disclaimer and quarterly summary.
CFDs are complex instruments and come with a high risk of losing money rapidly due to leverage. 69% of retail investor accounts lose money when trading CFDs with this provider. You should consider whether you understand how CFDs work and whether you can afford to take the high risk of losing your money. CFD and Forex Trading are leveraged products and your capital is at risk. They may not be suitable for everyone. Please ensure you fully understand the risks involved by reading our full risk warning.
City Index is a trading name of StoneX Financial Ltd. Head and Registered Office: 1st Floor, Moor House, 120 London Wall, London, EC2Y 5ET. StoneX Financial Ltd is a company registered in England and Wales, number: 05616586. Authorised and regulated by the Financial Conduct Authority. FCA Register Number: 446717.
City Index is a trademark of StoneX Financial Ltd.
The information on this website is not targeted at the general public of any particular country. It is not intended for distribution to residents in any country where such distribution or use would contravene any local law or regulatory requirement.
© City Index 2024