Daily Forex Technical Strategy Thurs 01 Aug
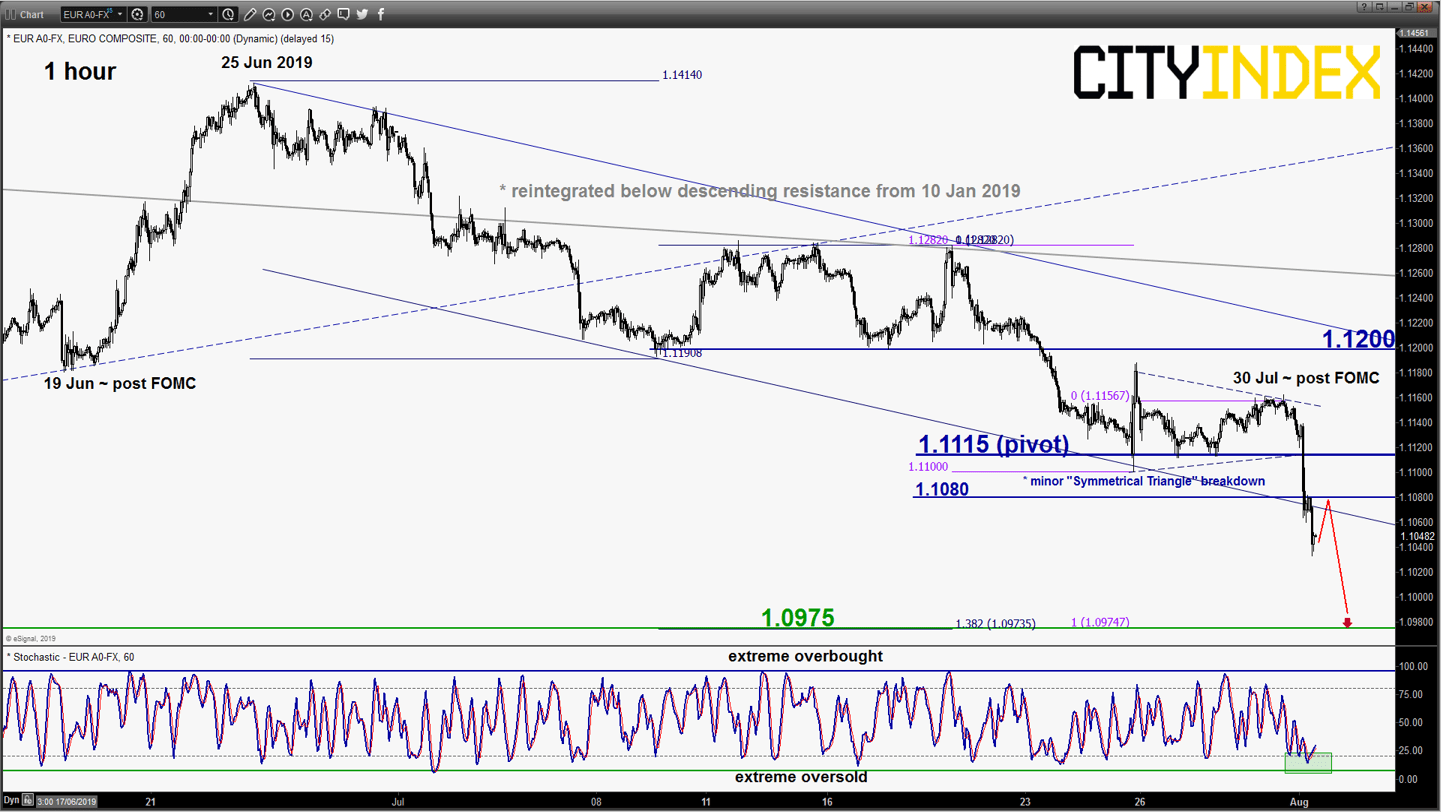
EUR/USD – Bearish breakdown from minor consolidation; further potential drop
click to enlarge chart
- The pair has staged the expected bearish breakdown from the minor “Symmetrical Triangle” range configuration in place since last Thurs, 25 Jul as per highlighted in our previous report (click here for a recap) and hit the short-term downside target/support at 1.1060.
- The hourly Stochastic oscillator has started to exit from its oversold region which indicates the risk of a minor rebound within a medium-term bearish trend that remains intact since 25 Jun 2019 high. Maintain bearish bias in any bounces below a tightened key short-term pivotal resistance now at 1.1115 for another potential downleg to target the next support at 1.0975 (Fibonacci projection cluster & “Head & Shoulders” breakdown projected exit target).
- However, a clearance with an hourly close above 1.1115 negates the bearish tone for an extension of the corrective rebound towards 1.1200 resistance.
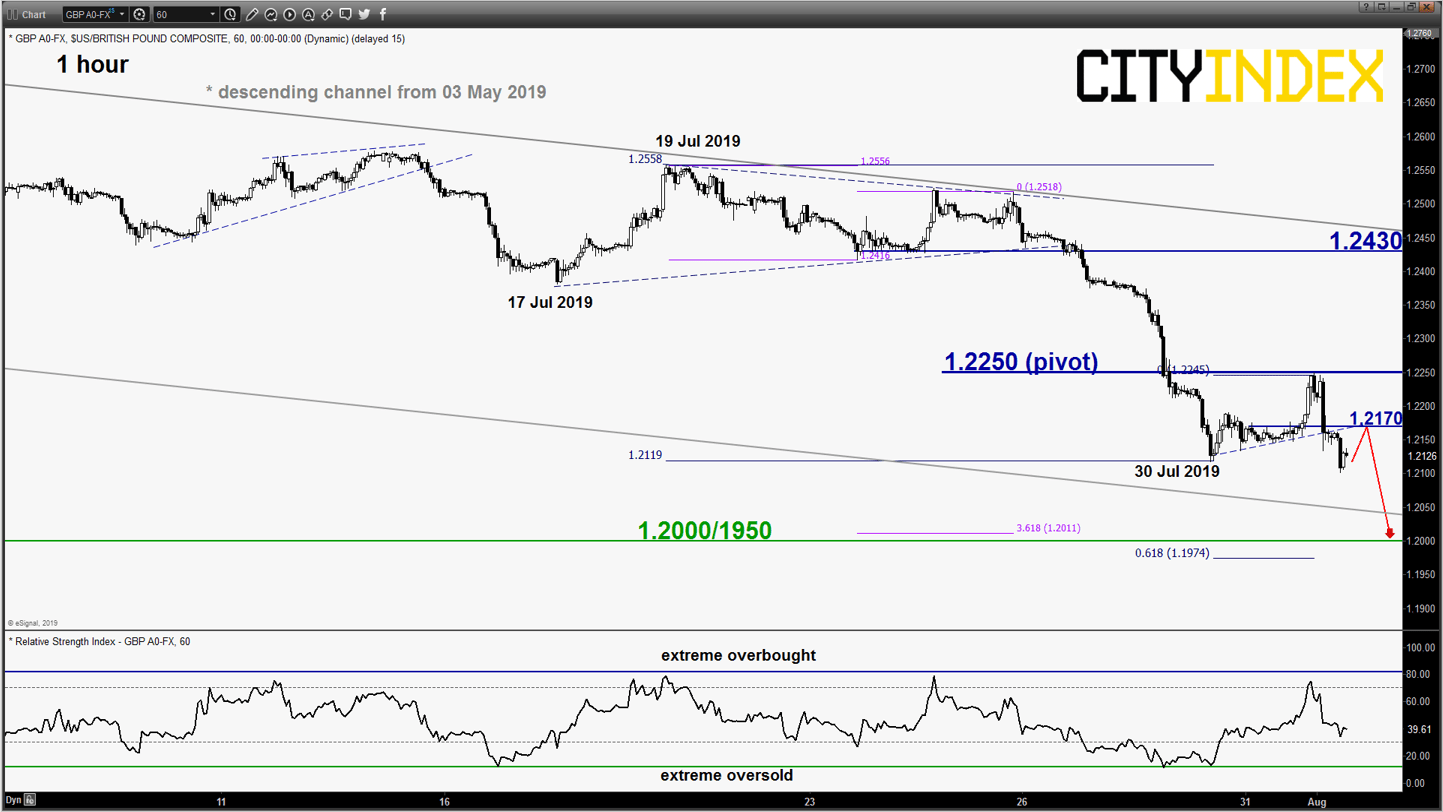
GBP/USD – Minor corrective rebound ended; potential impulsive down move resumes
click to enlarge chart
- The pair has staged the expected minor corrective rebound to print an intraday high of 1.2250 prior to yesterday’s FOMC decision; just 20 pips shy of the upside target/resistance of 1.2270 as per highlighted in our report. Thereafter, it has staged to decline and hit the 1.2100 before a bounce of 40 pips seen in today’s Asian session.
- Despite the pair has manged to hold at the 1.2100 key short-term support (highlighted in our previous report to maintain the minor corrective rebound scenario), the bearish breakdown of the EUR/USD and current Elliot Wave/fractal analysis of GBP/USD has reduced the conviction for a further corrective rebound. Thus, we flip back to a bearish bias in any bounces below 1.2250 key short-term pivotal resistance for another potential downleg to target the next support at 1.2000/1950 (Fibonacci projection cluster & Oct 2016 low).
- However, a clearance with an hourly close above 1.2250 negates the bearish tone for an extension of the corrective rebound towards the 1.2430 resistance.
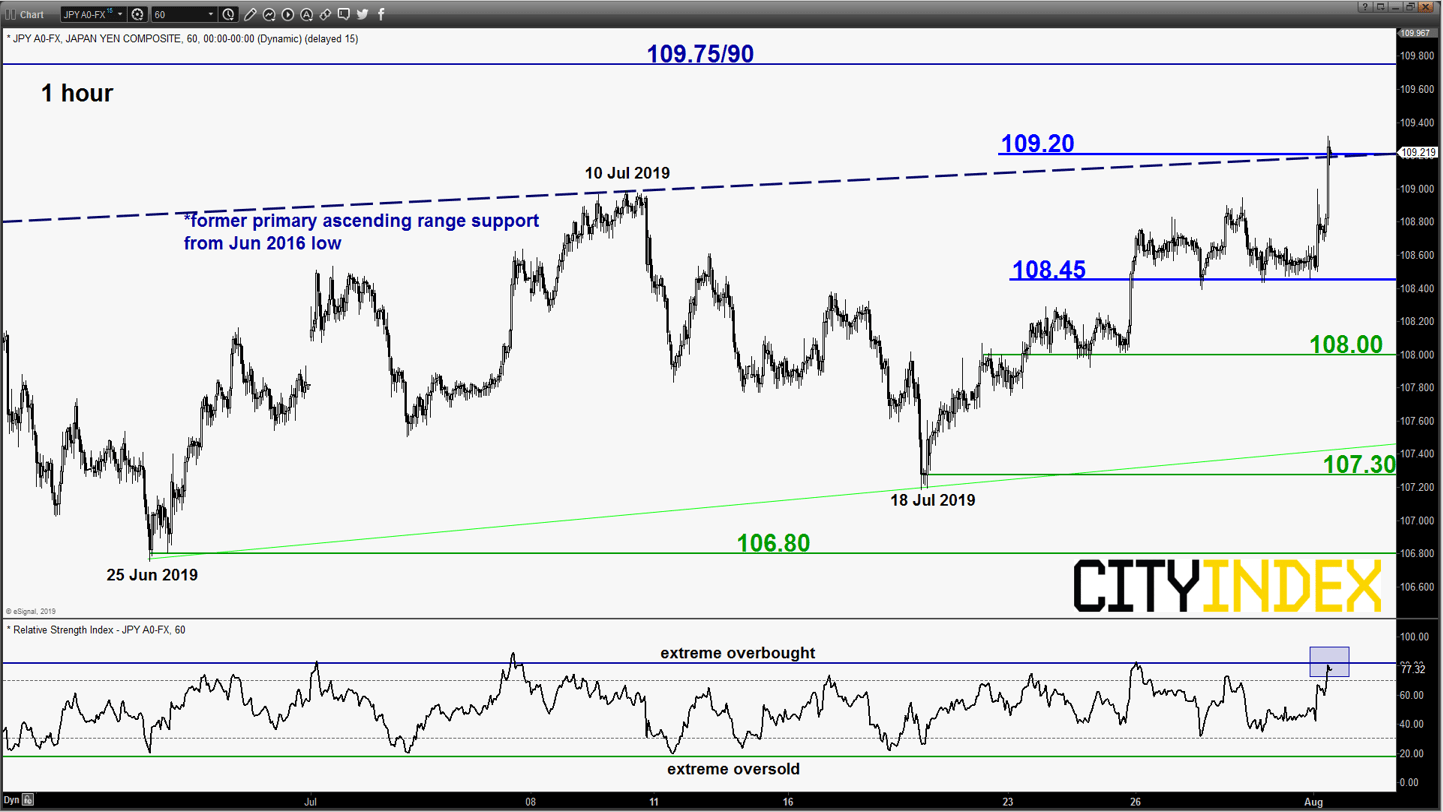
USD/JPY – Squeezed up towards 109.20 key medium-term resistance
click to enlarge chart
- The pair squeezed up towards the 109.00/109.20 key medium-term pivotal resistance post FOMC but no clear bearish signals at this juncture. Thus, prefer to turn neutral between 109.20 and 108.45. Only an hourly close below 108.45 is likely to reignite the bearish tone for a slide towards 108.00 follow by 107.30 range support.
- On the flipside, a daily close above 109.20 sees a further squeeze up towards the next resistance at 109.75/90 (30 May 2019 swing high & close to 50% Fibonacci retracement of the previous down move from 24 Apr high to 25 Jun 2019 low).
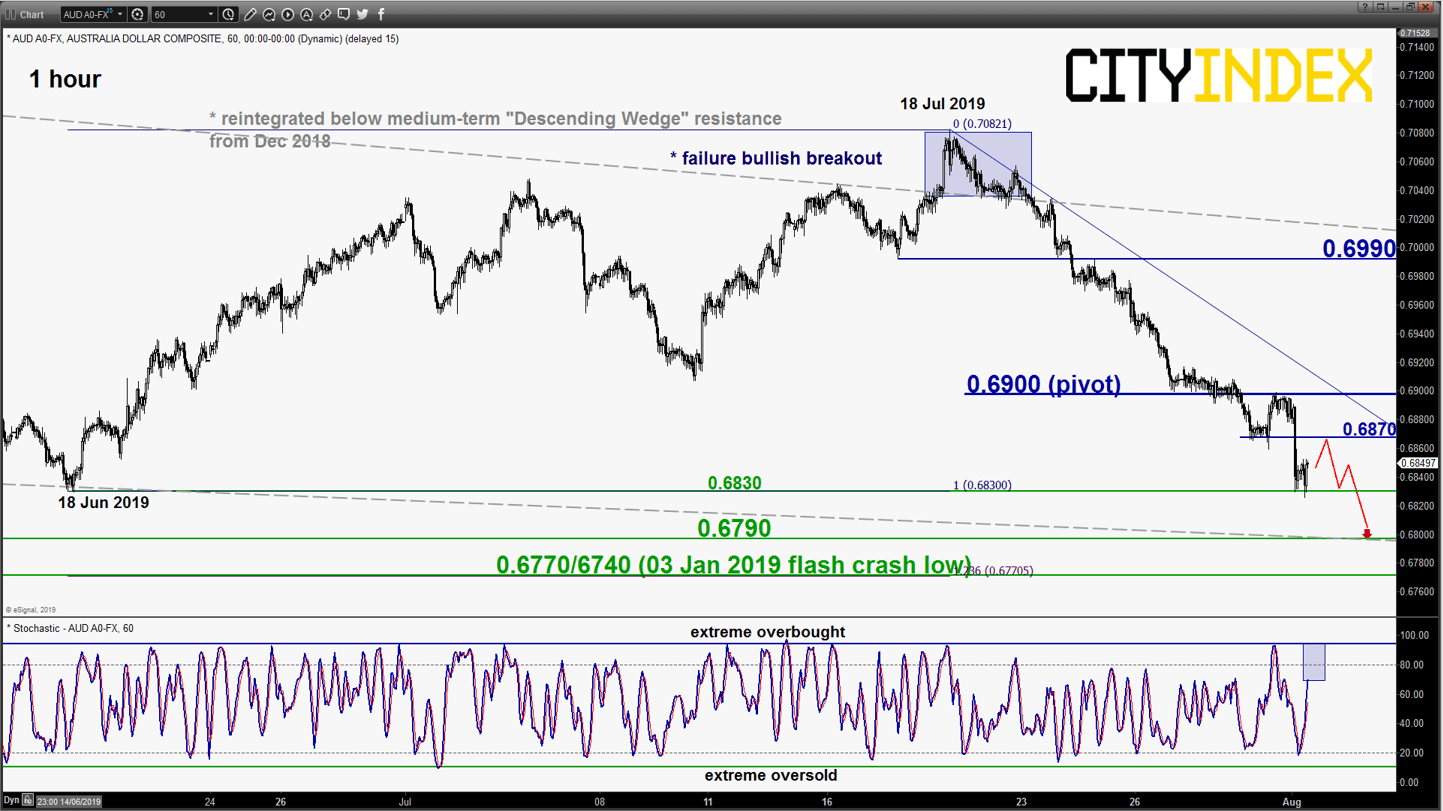
AUD/USD – Potential impulsive down move resumes
click to enlarge chart
- Yesterday’s corrective bounce fell short of the expected target/resistance of 0.6945 as it only printed a high of 0.6900 before it tumbled and broke below the 0.6860 key short-term support as per highlighted in our previous report.
- The impulsive down move is likely to have resumed; flip back to a bearish bias in any bounces below 0.6900 key short-term pivotal resistance for a further potential downleg to target the next support at 0.6790 in the first step.
- However, a clearance with an hourly close above 0.6900 invalidates the bearish scenario for a corrective rebound towards the next resistance at 0.6990.
Charts are from eSignal
StoneX Financial Ltd (trading as “City Index”) is an execution-only service provider. This material, whether or not it states any opinions, is for general information purposes only and it does not take into account your personal circumstances or objectives. This material has been prepared using the thoughts and opinions of the author and these may change. However, City Index does not plan to provide further updates to any material once published and it is not under any obligation to keep this material up to date. This material is short term in nature and may only relate to facts and circumstances existing at a specific time or day. Nothing in this material is (or should be considered to be) financial, investment, legal, tax or other advice and no reliance should be placed on it.
No opinion given in this material constitutes a recommendation by City Index or the author that any particular investment, security, transaction or investment strategy is suitable for any specific person. The material has not been prepared in accordance with legal requirements designed to promote the independence of investment research. Although City Index is not specifically prevented from dealing before providing this material, City Index does not seek to take advantage of the material prior to its dissemination. This material is not intended for distribution to, or use by, any person in any country or jurisdiction where such distribution or use would be contrary to local law or regulation.
For further details see our full non-independent research disclaimer and quarterly summary.
CFDs are complex instruments and come with a high risk of losing money rapidly due to leverage. 69% of retail investor accounts lose money when trading CFDs with this provider. You should consider whether you understand how CFDs work and whether you can afford to take the high risk of losing your money. CFD and Forex Trading are leveraged products and your capital is at risk. They may not be suitable for everyone. Please ensure you fully understand the risks involved by reading our full risk warning.
City Index is a trading name of StoneX Financial Ltd. Head and Registered Office: 1st Floor, Moor House, 120 London Wall, London, EC2Y 5ET. StoneX Financial Ltd is a company registered in England and Wales, number: 05616586. Authorised and regulated by the Financial Conduct Authority. FCA Register Number: 446717.
City Index is a trademark of StoneX Financial Ltd.
The information on this website is not targeted at the general public of any particular country. It is not intended for distribution to residents in any country where such distribution or use would contravene any local law or regulatory requirement.
© City Index 2024