Daily Forex Technical Strategy Fri 20 Dec
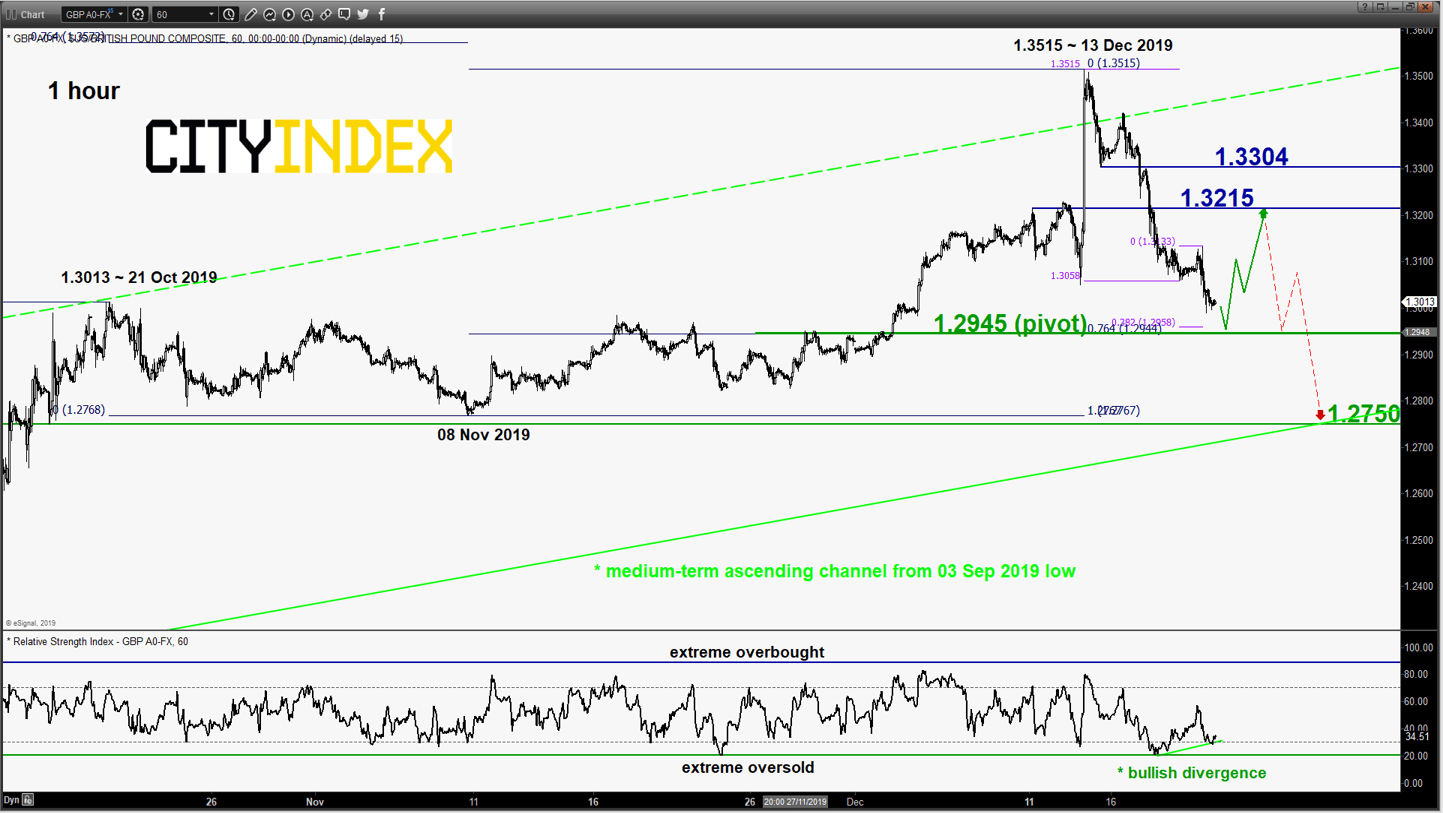
GBP/USD – A potential minor rebound is on the cards
click to enlarge chart
- The pair has staged the expected slide and hit the short-term target/support of 1.3000/2970 as per highlighted in our previous report (click here for a recap).
- Fractal/Elliot Wave analysis suggests a potential minor rebound to retrace the on-going slide from 13 Dec 2019 high of 1.3515 as the price action of the pair is approaching a Fibonacci retracement/expansion cluster at 1.2945.
- In addition, the hourly RSI oscillator has traced out a bullish divergence signal at its oversold region. Flip to a bullish bias with 1.2945 as the short-term pivotal support for a potential minor rebound to target the intermediate resistance at 1.3215 max 1.3300 before another downleg materialises.
- However, an hourly close below 1.2945 invalidates the rebound scenario for a continuation of the slide towards the upper limit of the key medium-term support at 1.2750 (lower boundary of the ascending channel from 03 Sep 2019 low & 50% Fibonacci retracement of the up move from 03 Sep low to 13 Dec 2019 high).
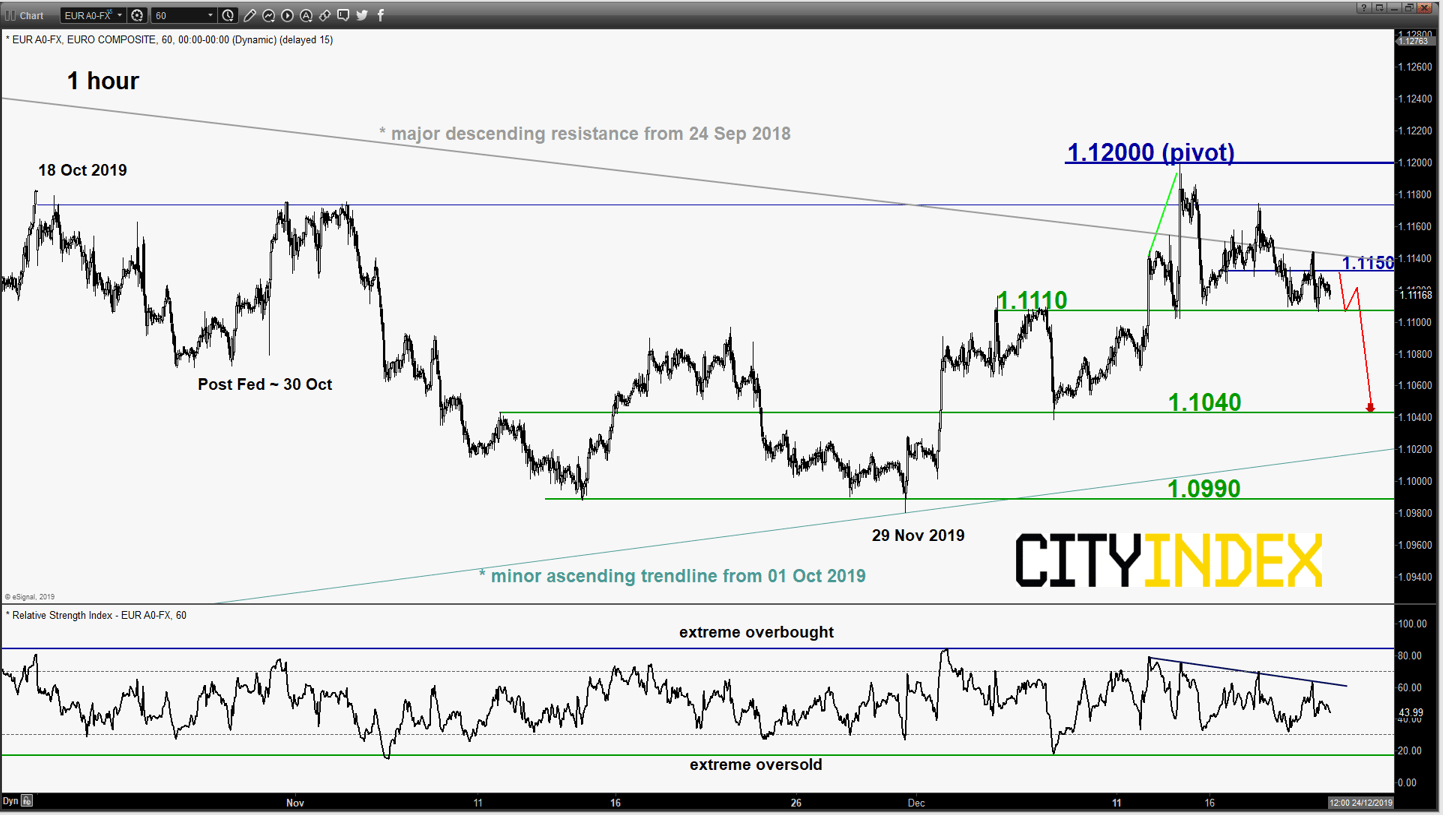
EUR/USD – 1.1200 remains the key resistance to watch
click to enlarge chart
- No major changes on its price action configuration, as the pair hit the first short-term support at 1.1110 and traded sideways thereafter.
- 1.1200 remains the pivotal resistance for a potential push down to test the next near-term support at 1.1040 within a range configuration. However, a daily close above 1.1200 sees a bullish breakout for a further push up towards the next intermediate resistance at 1.1285.
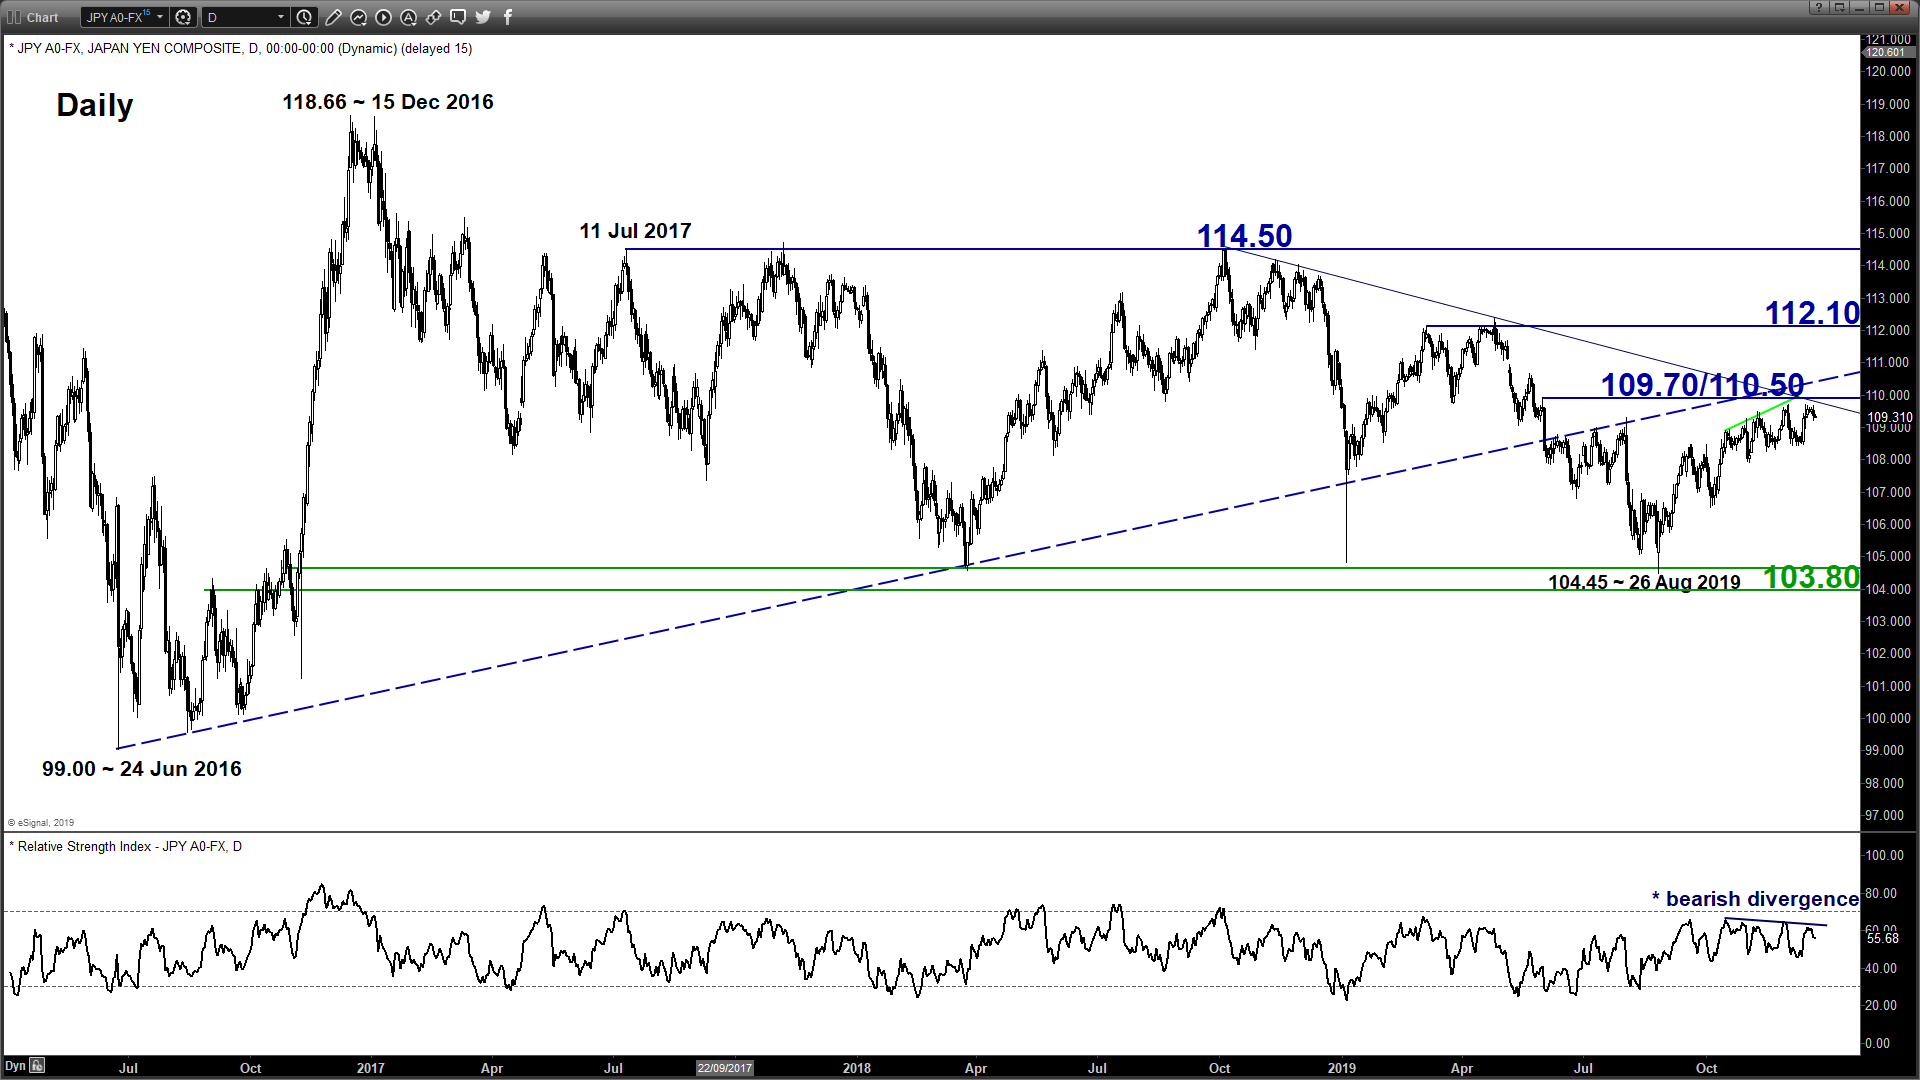
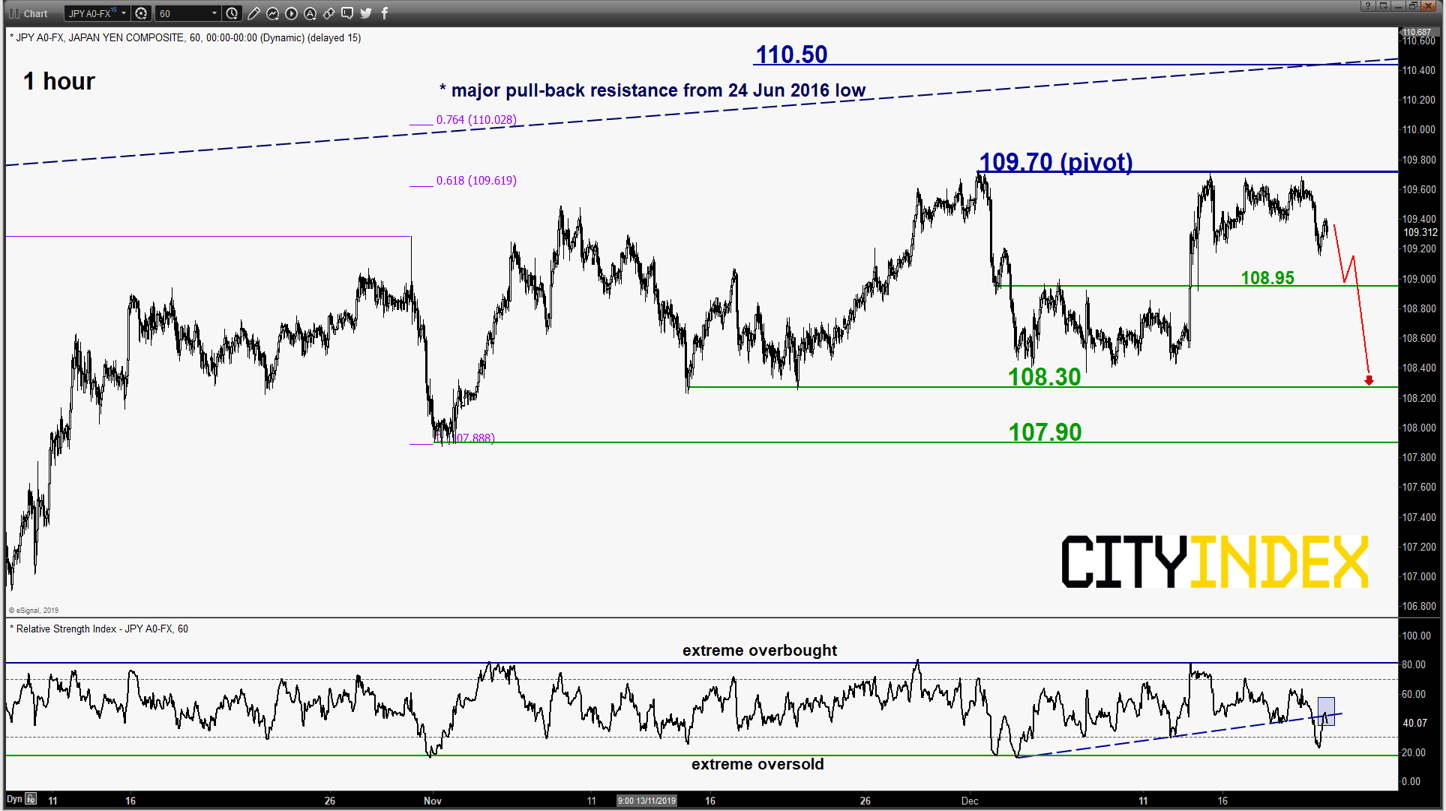
USD/JPY – Bulls are still hesitant as liquidity thins ahead of year end
click to enlarge charts
- No change, 109.70 remains the key short-term pivotal resistance for a potential push down to retest 108.95 and below it sees a further slide towards the minor range support area of 108.30/107.90.
- However, an hourly close above 109.70 negates the bearish tone for a further squeeze up to test the 110.50 major resistance.
AUD/USD – Neutral stance intact
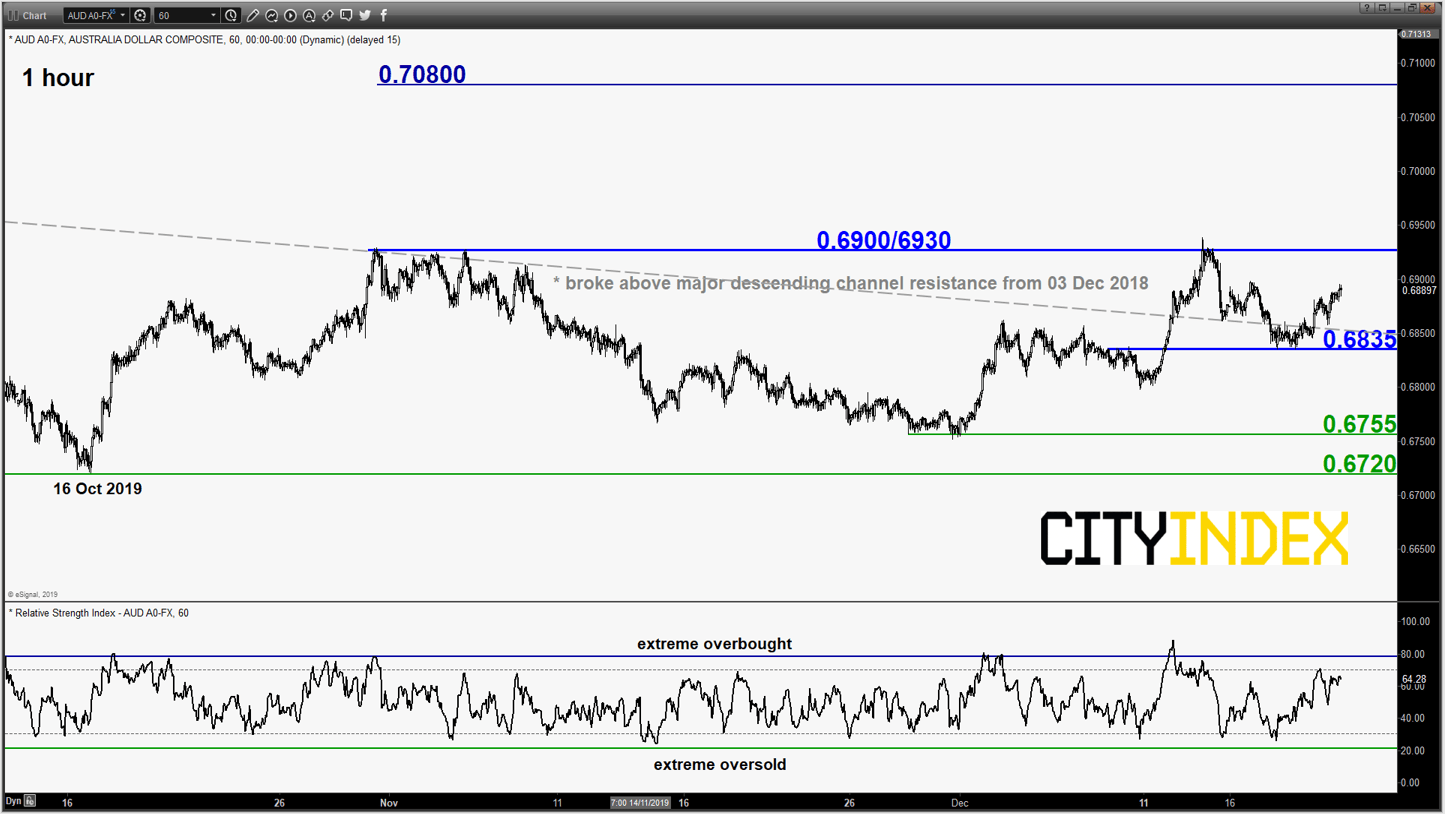
click to enlarge chart
- Continued to trade sideways above the pull-back support of the former major descending channel resistance from 03 Dec 2018 high. Remain neutral between 0.6930 and 0.6860. An hourly close above 0.6930 sees a further push up to target the next resistance at 0.7080 (18 Jul 2019 medium-term swing high).
- On the flipside, a break below 0.6860 invalidates the bullish breakout for a slide back into the range configuration to retest 0.6755/6720 support.
Charts are from eSignal
StoneX Financial Ltd (trading as “City Index”) is an execution-only service provider. This material, whether or not it states any opinions, is for general information purposes only and it does not take into account your personal circumstances or objectives. This material has been prepared using the thoughts and opinions of the author and these may change. However, City Index does not plan to provide further updates to any material once published and it is not under any obligation to keep this material up to date. This material is short term in nature and may only relate to facts and circumstances existing at a specific time or day. Nothing in this material is (or should be considered to be) financial, investment, legal, tax or other advice and no reliance should be placed on it.
No opinion given in this material constitutes a recommendation by City Index or the author that any particular investment, security, transaction or investment strategy is suitable for any specific person. The material has not been prepared in accordance with legal requirements designed to promote the independence of investment research. Although City Index is not specifically prevented from dealing before providing this material, City Index does not seek to take advantage of the material prior to its dissemination. This material is not intended for distribution to, or use by, any person in any country or jurisdiction where such distribution or use would be contrary to local law or regulation.
For further details see our full non-independent research disclaimer and quarterly summary.
CFDs are complex instruments and come with a high risk of losing money rapidly due to leverage. 69% of retail investor accounts lose money when trading CFDs with this provider. You should consider whether you understand how CFDs work and whether you can afford to take the high risk of losing your money. CFD and Forex Trading are leveraged products and your capital is at risk. They may not be suitable for everyone. Please ensure you fully understand the risks involved by reading our full risk warning.
City Index is a trading name of StoneX Financial Ltd. Head and Registered Office: 1st Floor, Moor House, 120 London Wall, London, EC2Y 5ET. StoneX Financial Ltd is a company registered in England and Wales, number: 05616586. Authorised and regulated by the Financial Conduct Authority. FCA Register Number: 446717.
City Index is a trademark of StoneX Financial Ltd.
The information on this website is not targeted at the general public of any particular country. It is not intended for distribution to residents in any country where such distribution or use would contravene any local law or regulatory requirement.
© City Index 2024