Daily Forex Technical Strategy Fri 13 Sep
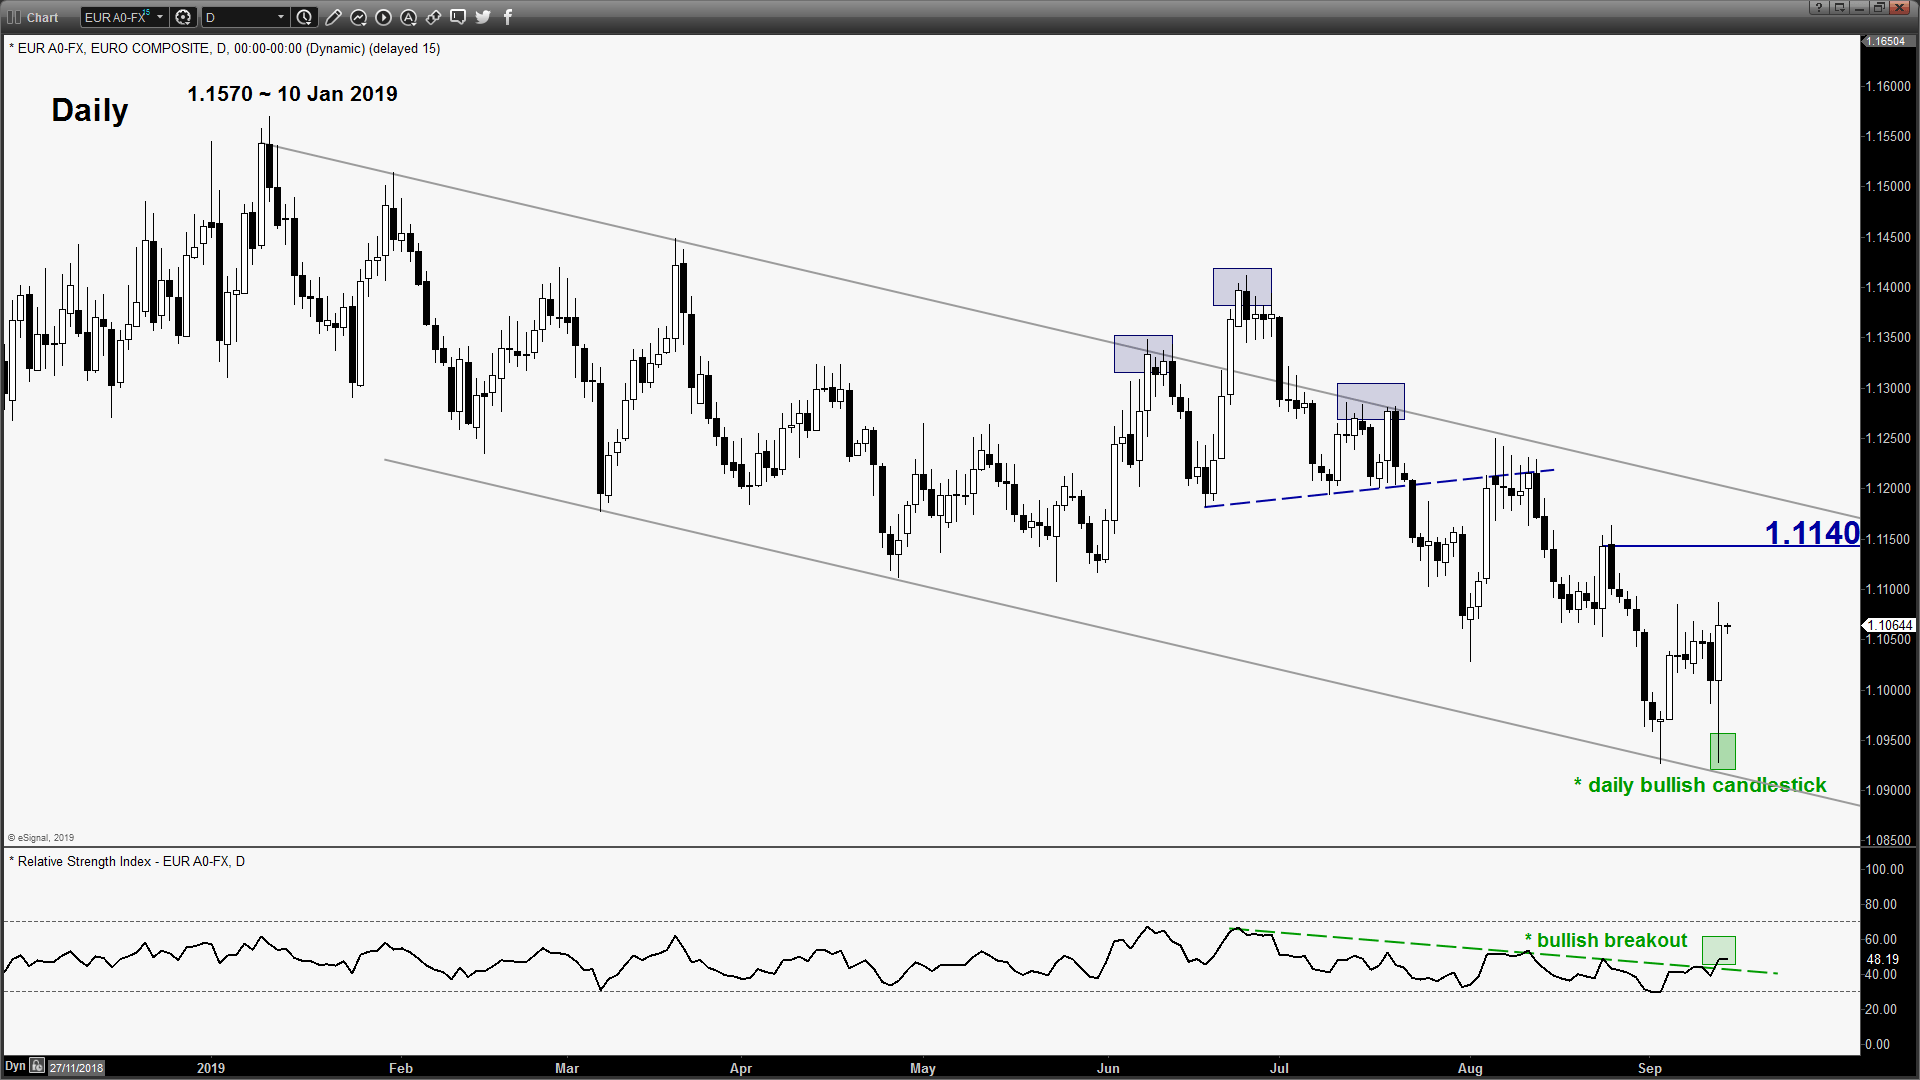
EUR/USD – Wild swing but ended positive post ECB
click to enlarge charts
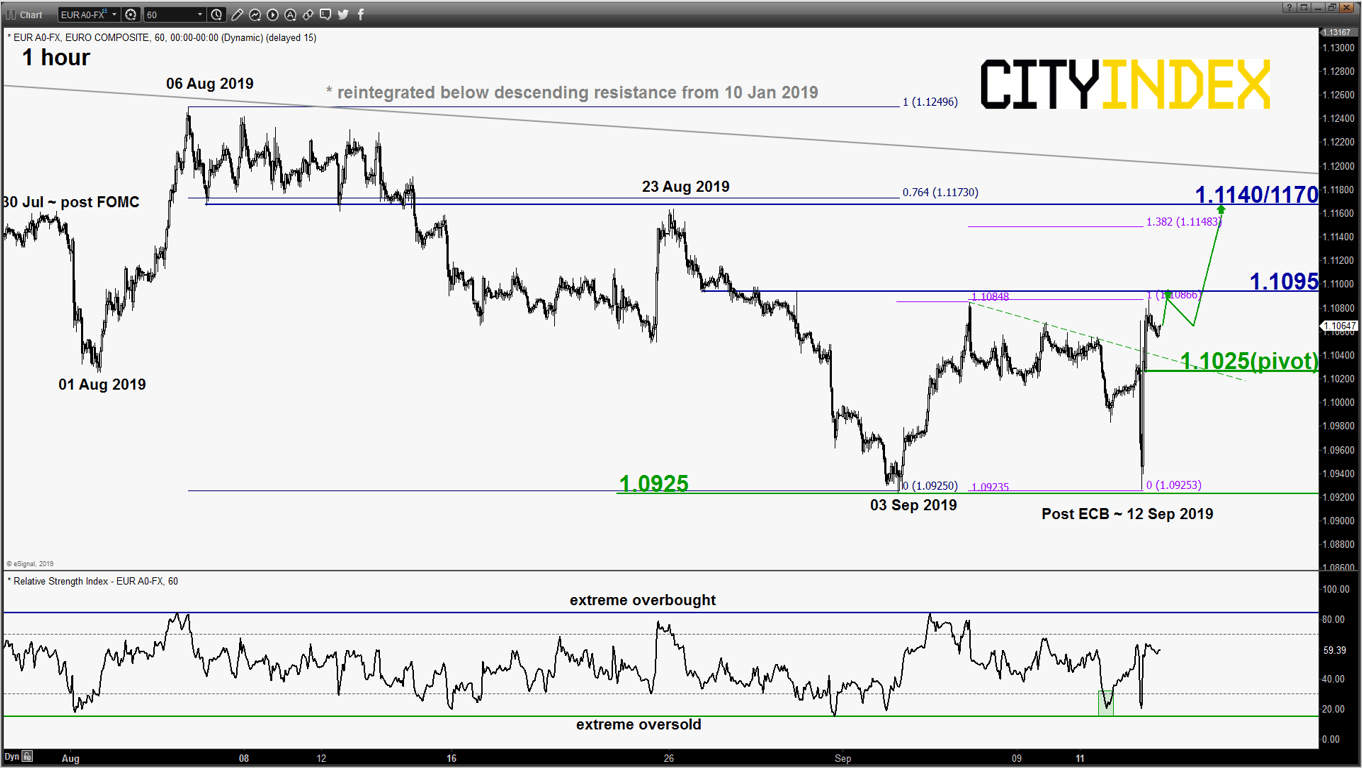
- Wild swing of close to 150 pips was seen for the pair post ECB where the European central bank reintroduced QE programme to combat economic weakness in Eurozone, only just after 9-months where it was ended. It plummeted and broke below the 1.1000 key short-term support as per highlighted in our previous report (click here for a recap) and retested the 03 Sep 2019 swing low of 1.0925. Thereafter, it staged a sudden reversal to the upside after ECB governor Draghi press conference where he stated the limitations of monetary policies and it is now the time for fiscal policy to take the centre stage to revive economic growth.
- The pair ended yesterday, 12 Sep U.S. session with a bullish candlestick coupled with positive medium-term momentum as indicated by the daily RSI oscillator. Thus, we still maintain the bullish bias and use 1.1025 as short-term pivotal support for today (the pull-back support of the former minor descending resistance from 04 Sep & Fibonacci retracement/projection cluster) to see a continuation of the 2nd leg of potential corrective rebound phase to target the next resistance at 1.1095 follow by 1.1140/1170 next.
- On the other hand, a break with an hourly close below 1.1000 negates the bullish tone to see a further another choppy slide to retest 1.0925.
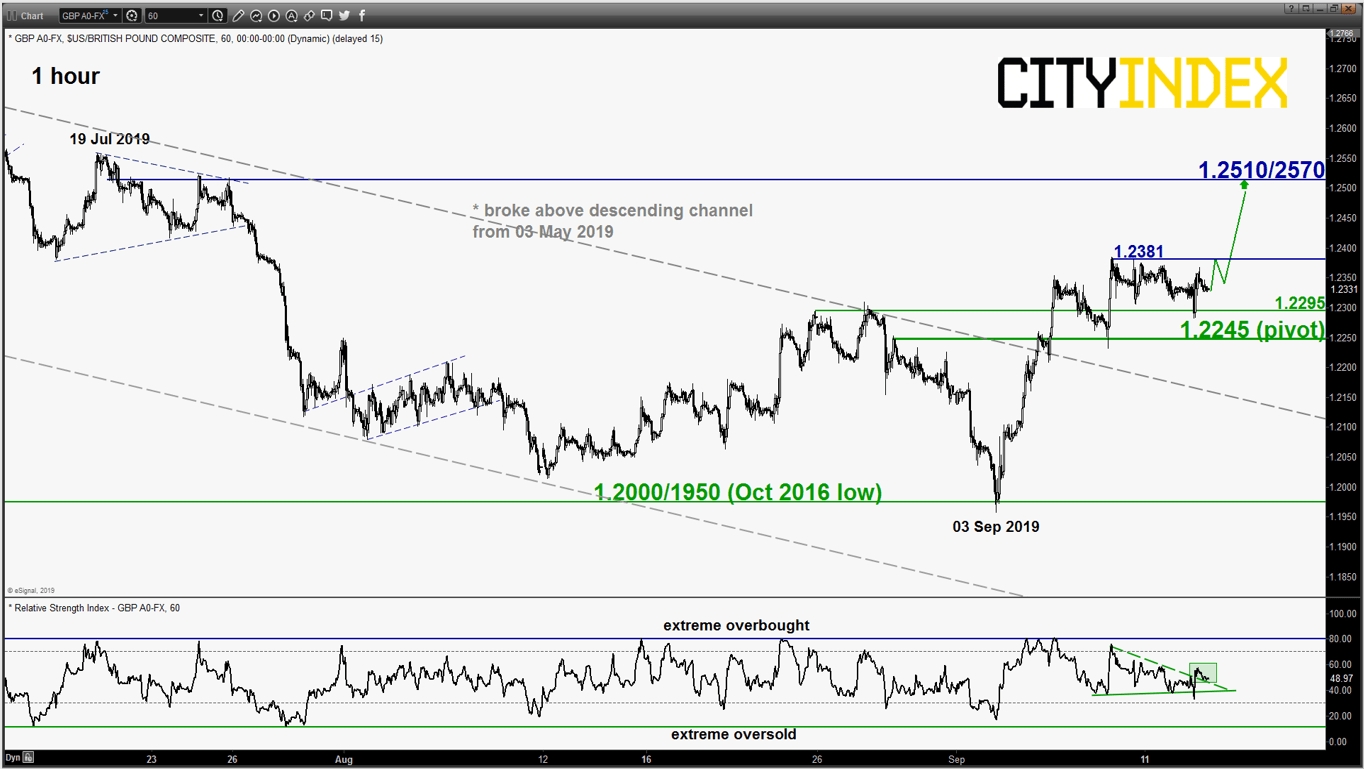
GBP/USD – 1.2245 remains the key support to watch
click to enlarge chart
- The pair has managed to hold above the 1.2245 key short-term pivotal support as per highlighted in our previous report post ECB. No change in key elements; maintain bullish bias and a break above 1.2380 reinforces another leg of potential corrective rebound to target the key resistance at 1.2510/2570 (upper boundary minor ascending channel from 03 Sep 2019 low & former major ascending support from 07 Oct 2016 low).
- On the other hand, a break with an hourly close below 1.2245 invalidates the corrective rebound scenario for a bearish reversal to retest 1.2000/1950 in the first step.
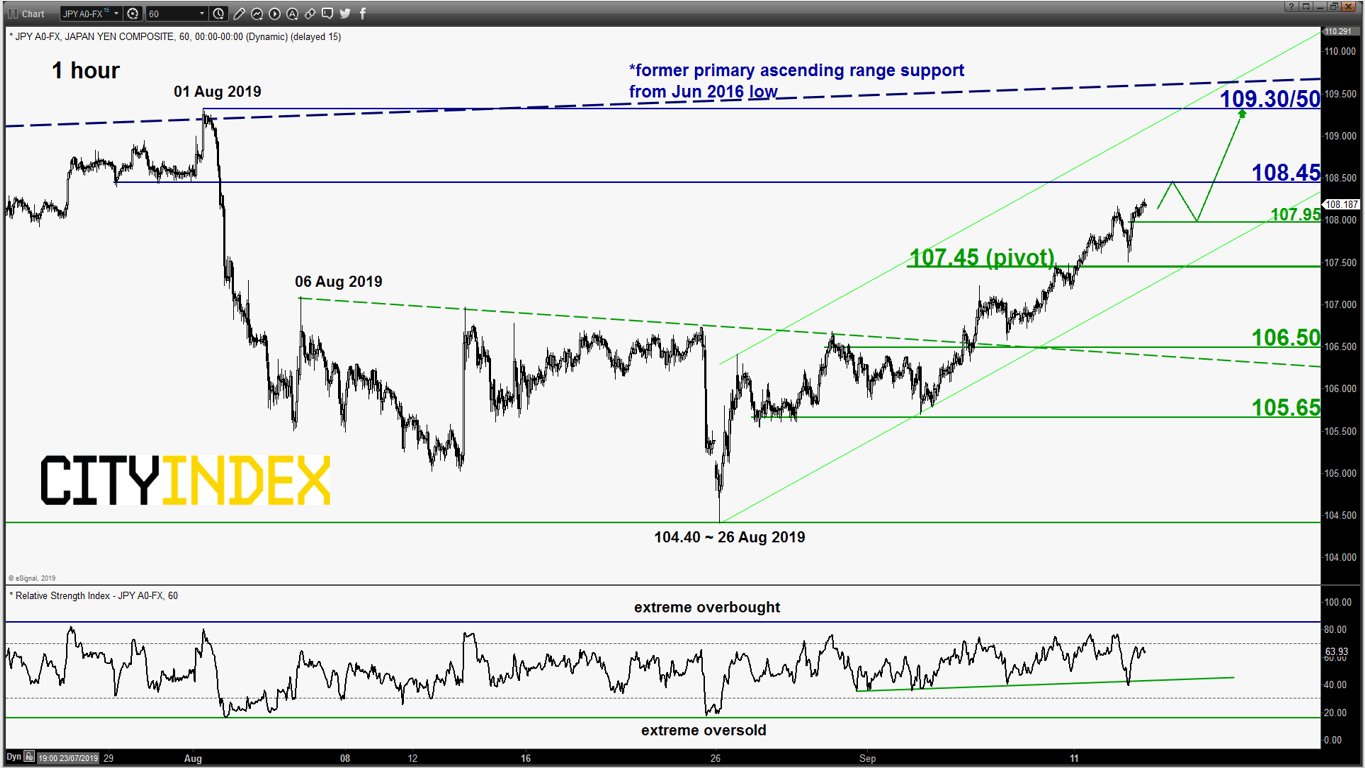
USD/JPY – Further potential push up towards key resistance
click to enlarge chart
- The pair has staged the expected towards pull-back towards the intermediate support of 107.45 as per highlighted in our previous report. It printed a low of 107.50 in yesterday, U.S session before it pushed up higher to print a higher minor high of 108.26 seen in today’s early Asian session on the backdrop of the on-going “risk on optimism”.
- Maintain bullish bias in any dips with an adjusted key short-term pivotal support at 107.45 for a further potential corrective rebound towards 108.45 and the key resistance of 109.30/50 before a potential reversal sets in. On the other hand, a break with an hourly close below 107.45 invalidates the corrective rebound scenario for another round of choppy slide back towards 106.50 in the first step.
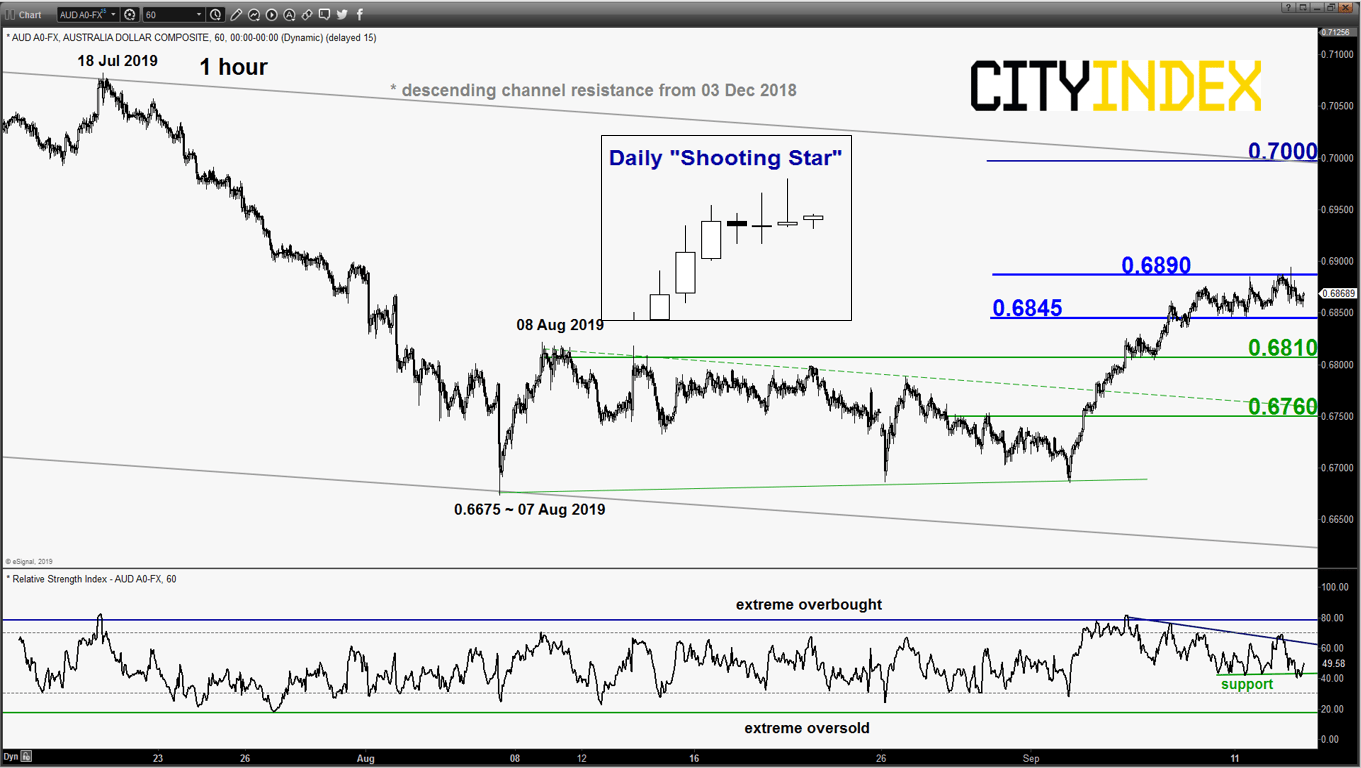
AUD/USD – Mix elements, turn neutral
click to enlarge chart
- The pair has refused to have a clear break above the 0.6875 key short-term pivotal resistance after a challenge on it yesterday and ended the U.S. session with a daily bearish “Shooting Star” candlestick. But it also failed to crack below 0.6845 supported by the on-going “risk on optimism”.
- Thus, prefer to turn neutral now between 0.6845 and 0.6890. Only an hourly close below 0.6845 revives the minor slide scenario towards 0.6810 and 0.6760. On the flipside, a clearance with an hourly close above 0.6890 sees the continuation of the corrective rally towards 0.7000 next (upper boundary of the descending channel from 03 Dec 2018 high).
Charts are from eSignal
StoneX Financial Ltd (trading as “City Index”) is an execution-only service provider. This material, whether or not it states any opinions, is for general information purposes only and it does not take into account your personal circumstances or objectives. This material has been prepared using the thoughts and opinions of the author and these may change. However, City Index does not plan to provide further updates to any material once published and it is not under any obligation to keep this material up to date. This material is short term in nature and may only relate to facts and circumstances existing at a specific time or day. Nothing in this material is (or should be considered to be) financial, investment, legal, tax or other advice and no reliance should be placed on it.
No opinion given in this material constitutes a recommendation by City Index or the author that any particular investment, security, transaction or investment strategy is suitable for any specific person. The material has not been prepared in accordance with legal requirements designed to promote the independence of investment research. Although City Index is not specifically prevented from dealing before providing this material, City Index does not seek to take advantage of the material prior to its dissemination. This material is not intended for distribution to, or use by, any person in any country or jurisdiction where such distribution or use would be contrary to local law or regulation.
For further details see our full non-independent research disclaimer and quarterly summary.
CFDs are complex instruments and come with a high risk of losing money rapidly due to leverage. 69% of retail investor accounts lose money when trading CFDs with this provider. You should consider whether you understand how CFDs work and whether you can afford to take the high risk of losing your money. CFD and Forex Trading are leveraged products and your capital is at risk. They may not be suitable for everyone. Please ensure you fully understand the risks involved by reading our full risk warning.
City Index is a trading name of StoneX Financial Ltd. Head and Registered Office: 1st Floor, Moor House, 120 London Wall, London, EC2Y 5ET. StoneX Financial Ltd is a company registered in England and Wales, number: 05616586. Authorised and regulated by the Financial Conduct Authority. FCA Register Number: 446717.
City Index is a trademark of StoneX Financial Ltd.
The information on this website is not targeted at the general public of any particular country. It is not intended for distribution to residents in any country where such distribution or use would contravene any local law or regulatory requirement.
© City Index 2024