Crude volatility here to stay as traders eye OPEC
Last week was a volatile one for crude oil. Brent and WTI prices rose in the first three days of the week but then gave back much of those gains in the last two. Nevertheless both contracts managed to eke out gains for the week and it was the first positive week in four for Brent. And following a weaker start this morning, oil prices have turned slightly higher. The volatility therefore continues as Friday’s OPEC meeting nears. The pressure is growing on Saudi Arabia to cut production after it convinced the cartel to keep oil output high in order to maintain market share and presumably squeeze shale and other weaker producers out of the market. That strategy has so far failed to work effectively with rivals proving to be surprisingly resilient and shale output has fallen only slightly. Meanwhile oil prices have dropped far more, and remained depressed longer, than what the Saudis and indeed many other oil producers had envisaged last year. Saudi’s oil minister last week appeared as if he had changed his tone slightly and this has led to some speculation that the OPEC’s largest player may rethink its strategy. However it is unlikely that a production cut will be agreed upon as Saudi and a few other OPEC members can still survive at current oil prices for a lot longer than some of their rivals. So although prices being this low may be uncomfortable for the OPEC for now, it may still pay off in the long term as soon or later some of the weaker non-OPEC producers will be forced out of the market. With rig counts continuing to drop, it could be only a matter of time before the rebalancing process begins to accelerate and the market tightens.
But in the near-term and in light of the still-oversupplied oil market, any price gains are likely to be short-lived, especially since Iran is most likely to increase its crude output as more sanctions are lifted. Oil speculators will also be reminded about the demand aspects of oil this week, for we have a large number of global macroeconomic pointers to look forward to, starting with the Chinese manufacturing PMIs on Tuesday. If they point to further deterioration in industrial demand from the world’s second largest consumer of oil then this won’t be good news for crude prices. However if the PMIs show a surprise expansion then we may see some further short-covering rally in oil.
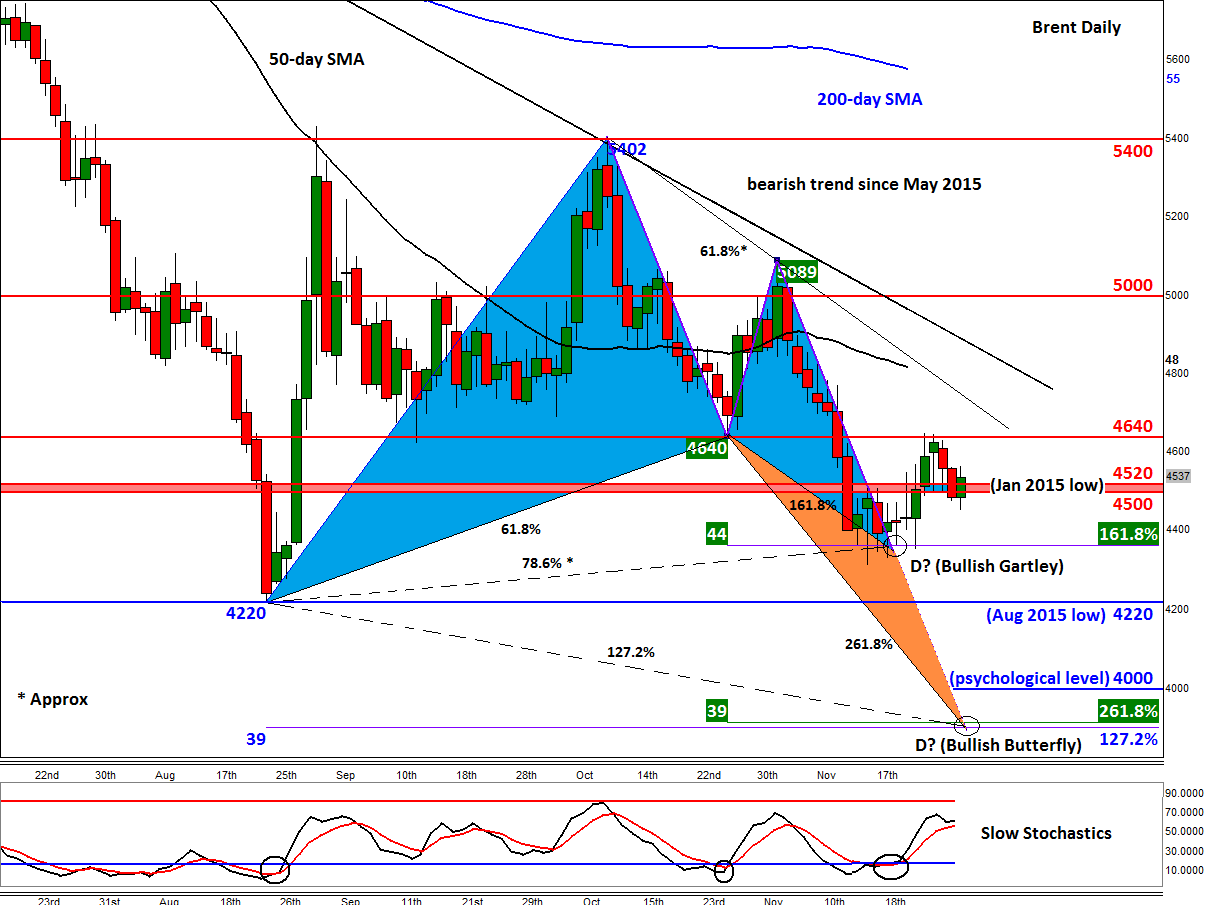
Brent crude was trading above the $45 a barrel mark at the time of this writing. It was thus continuing to hold above the key $43.50 – $44.00 area. This is where a Bullish Gartley pattern resides, which can sometimes pinpoint major lows in the markets. As this pattern is holding so far, there is still the possibility we may have seen the bottom in oil. Although Brent has taken out important resistance around the $45.00-$45.20 region, it has failed to break the more important $46.40 handle which was previously support. If this level now breaks then we may see a more aggressive rally, at least towards the bearish trend and the 50-day moving average, around $48.00 next.
But if Brent fails once again at these levels and eventually falls below the abovementioned Bullish Gartley support, then the next logical target for the bears would be the August low around $42.20. Thereafter a more significant Bullish Butterfly pattern comes in around $39. This formation is the same as the Gartley in that it is constructed by Fibonacci levels, but the point D comes in below the 100% retracement of XA, in this case at the 127.2% extension level. The CD leg is also extended – in this case, by 161.8 per cent times AB. The area around $39 is also where the 261.8% of the BC move resides, thus making it an exhaustion point. But will oil even get to $39 and even if it does, will it necessarily form a major base there? We could simply see a short-term bounce, before the trend resumes and oil prices fall further. So treat all these Gartley/Butterfly and indeed any other technical patterns with caution, especially when going against the underlying trend.
StoneX Financial Ltd (trading as “City Index”) is an execution-only service provider. This material, whether or not it states any opinions, is for general information purposes only and it does not take into account your personal circumstances or objectives. This material has been prepared using the thoughts and opinions of the author and these may change. However, City Index does not plan to provide further updates to any material once published and it is not under any obligation to keep this material up to date. This material is short term in nature and may only relate to facts and circumstances existing at a specific time or day. Nothing in this material is (or should be considered to be) financial, investment, legal, tax or other advice and no reliance should be placed on it.
No opinion given in this material constitutes a recommendation by City Index or the author that any particular investment, security, transaction or investment strategy is suitable for any specific person. The material has not been prepared in accordance with legal requirements designed to promote the independence of investment research. Although City Index is not specifically prevented from dealing before providing this material, City Index does not seek to take advantage of the material prior to its dissemination. This material is not intended for distribution to, or use by, any person in any country or jurisdiction where such distribution or use would be contrary to local law or regulation.
For further details see our full non-independent research disclaimer and quarterly summary.
CFDs are complex instruments and come with a high risk of losing money rapidly due to leverage. 69% of retail investor accounts lose money when trading CFDs with this provider. You should consider whether you understand how CFDs work and whether you can afford to take the high risk of losing your money. CFD and Forex Trading are leveraged products and your capital is at risk. They may not be suitable for everyone. Please ensure you fully understand the risks involved by reading our full risk warning.
City Index is a trading name of StoneX Financial Ltd. Head and Registered Office: 1st Floor, Moor House, 120 London Wall, London, EC2Y 5ET. StoneX Financial Ltd is a company registered in England and Wales, number: 05616586. Authorised and regulated by the Financial Conduct Authority. FCA Register Number: 446717.
City Index is a trademark of StoneX Financial Ltd.
The information on this website is not targeted at the general public of any particular country. It is not intended for distribution to residents in any country where such distribution or use would contravene any local law or regulatory requirement.
© City Index 2024