Crude turns positive ahead of oil data
Oil prices swung wildly into the positive territory yesterday. The rally eventually came to a halt around the $50 handle for Brent and $48 for WTI, and both contracts have been trending lower from these levels until an hour or so ago. It looks like oil prices have now found some short-covering support ahead of today’s official US crude oil inventories report, due at 15:30 BST (10:30 ET).
Evidently, yesterday’s upsurge was trigged by media reports that suggested Iran was willing to corporate with other large crude producers in a potential deal to curb oil output and boost prices. In a way, it was almost a repeat of what was happening earlier in the year when oil prices would jump on such headlines only for the gains to quickly evaporate on realisation that Iran was actually not going to be part of any deal. Then the buck-denominated oil prices had the additional support of a depreciating US dollar, as well as the declining US rig counts and oil production. This meant that when talks between the OPEC and Russia to freeze oil output failed, crude prices were able to rally anyway after a brief sell-off.
This time, US oil production has shown signs of stabilisation as the rig counts have actually been trending higher, while the dollar has stabilised somewhat. The market may therefore be able to call the OPEC’s bluff should we see clear signs that the talks will once again fail to materialise into any action. But will it be different this time? After all, Iran has been able to boost its crude oil production to levels that cannot be scaled up further in the near-term anyway due to infrastructure limitations and also because there is so much oil that it can sell in this saturated market. Saudi Arabia would of course be willing to freeze its oil output at these record levels. So a deal may be agreed upon this time, but there is a risk of a much stronger downward pressure on prices should they once again fail to agree on a freeze deal.
But ahead of next month’s informal OPEC meeting, oil prices are likely to find direction from the changes in general risk apatite in the markets, which appear to be bullish, as well as the weekly volatility in US oil inventories, production and rig counts – on these fronts, the news has been oil-bearish recently, though prices have nonetheless remained supported. Last night, the American Petroleum Institute (API) reported a sharp 4.5 million barrel increase in US oil inventories and a surprise build for stocks of gasoline. If these numbers are confirmed by the official Energy Information Administration (EIA) data this afternoon, then we could see some further downward pressure on oil prices later on. However, if the build turns out to be smaller or we see a surprise drawdown in oil stocks then expect to see a jump in WTI prices.
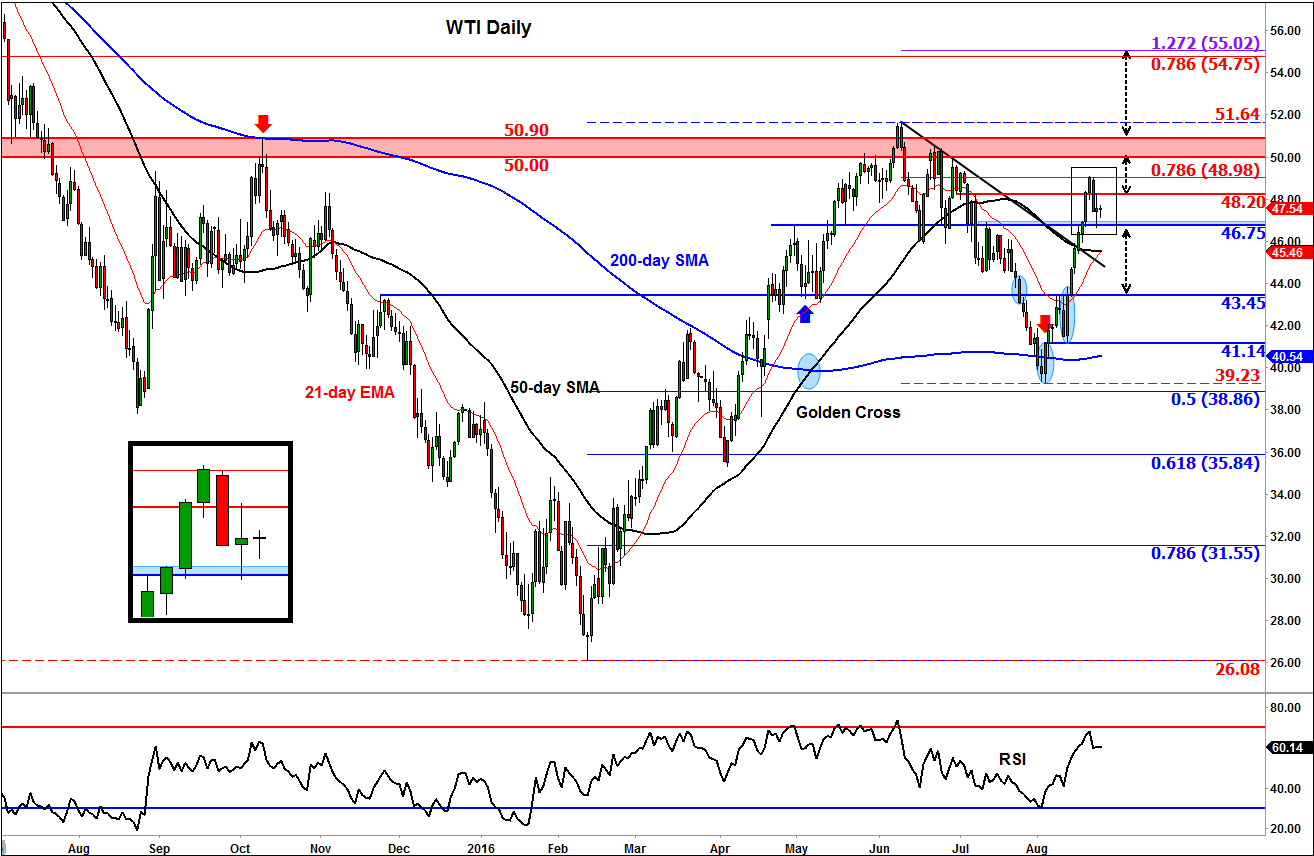
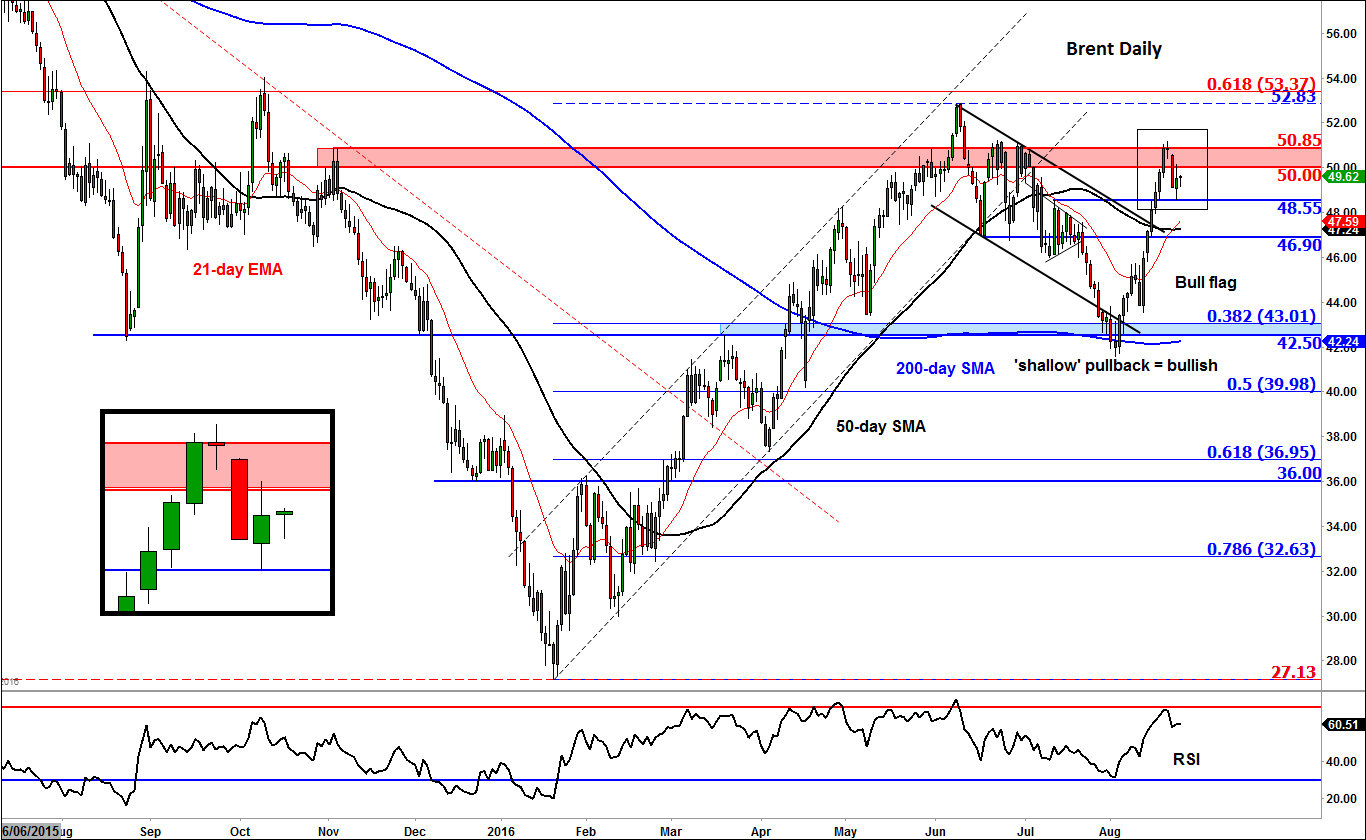
From a technical point of view, both oil contracts look poised for further potential gains in the medium term outlook. In the short-term however, there is a risk for a potential sell-off as prices have yet to break their key long-term resistance levels, with Brent repeatedly failing to climb or hold above the $50.00-50.85 area. WTI has likewise had a couple of failed attempts at trying to break its own psychological level of $50, although it didn’t quite manage to test this level in this latest rally. The key levels of support and resistance are shown on the charts in blue and red respectively.
StoneX Financial Ltd (trading as “City Index”) is an execution-only service provider. This material, whether or not it states any opinions, is for general information purposes only and it does not take into account your personal circumstances or objectives. This material has been prepared using the thoughts and opinions of the author and these may change. However, City Index does not plan to provide further updates to any material once published and it is not under any obligation to keep this material up to date. This material is short term in nature and may only relate to facts and circumstances existing at a specific time or day. Nothing in this material is (or should be considered to be) financial, investment, legal, tax or other advice and no reliance should be placed on it.
No opinion given in this material constitutes a recommendation by City Index or the author that any particular investment, security, transaction or investment strategy is suitable for any specific person. The material has not been prepared in accordance with legal requirements designed to promote the independence of investment research. Although City Index is not specifically prevented from dealing before providing this material, City Index does not seek to take advantage of the material prior to its dissemination. This material is not intended for distribution to, or use by, any person in any country or jurisdiction where such distribution or use would be contrary to local law or regulation.
For further details see our full non-independent research disclaimer and quarterly summary.
CFDs are complex instruments and come with a high risk of losing money rapidly due to leverage. 69% of retail investor accounts lose money when trading CFDs with this provider. You should consider whether you understand how CFDs work and whether you can afford to take the high risk of losing your money. CFD and Forex Trading are leveraged products and your capital is at risk. They may not be suitable for everyone. Please ensure you fully understand the risks involved by reading our full risk warning.
City Index is a trading name of StoneX Financial Ltd. Head and Registered Office: 1st Floor, Moor House, 120 London Wall, London, EC2Y 5ET. StoneX Financial Ltd is a company registered in England and Wales, number: 05616586. Authorised and regulated by the Financial Conduct Authority. FCA Register Number: 446717.
City Index is a trademark of StoneX Financial Ltd.
The information on this website is not targeted at the general public of any particular country. It is not intended for distribution to residents in any country where such distribution or use would contravene any local law or regulatory requirement.
© City Index 2024