Crude stocks may have snapped six week build streak
Oil prices have bounced back after Wednesday’s decline and are thus back higher on the week after Monday’s rally. As before, I think oil prices are heading higher. The lack of a clear trend over the past several weeks has coincided with rising US crude oil inventories to new record levels. But after a six-week streak of rises, US oil stocks are likely to have fallen last week. The official Energy Information Administration data will be published later this afternoon. Last night, unofficial data from the American Petroleum Institute (API) showed US oil inventories fell by 884 thousand barrels last week, while those at the storage hub of Cushing, Oklahoma, saw a draw of 1.73 million barrels – the sixth decline in seven weeks. According to the API, stocks of crude products declined sharply, too: gasoline by 893 thousand but more importantly for this time of the year, distillates dropped by a significant 4.23 million barrels. It was a bullish report from the API and if EIA’s numbers confirm these figures then we may see further gains for oil.
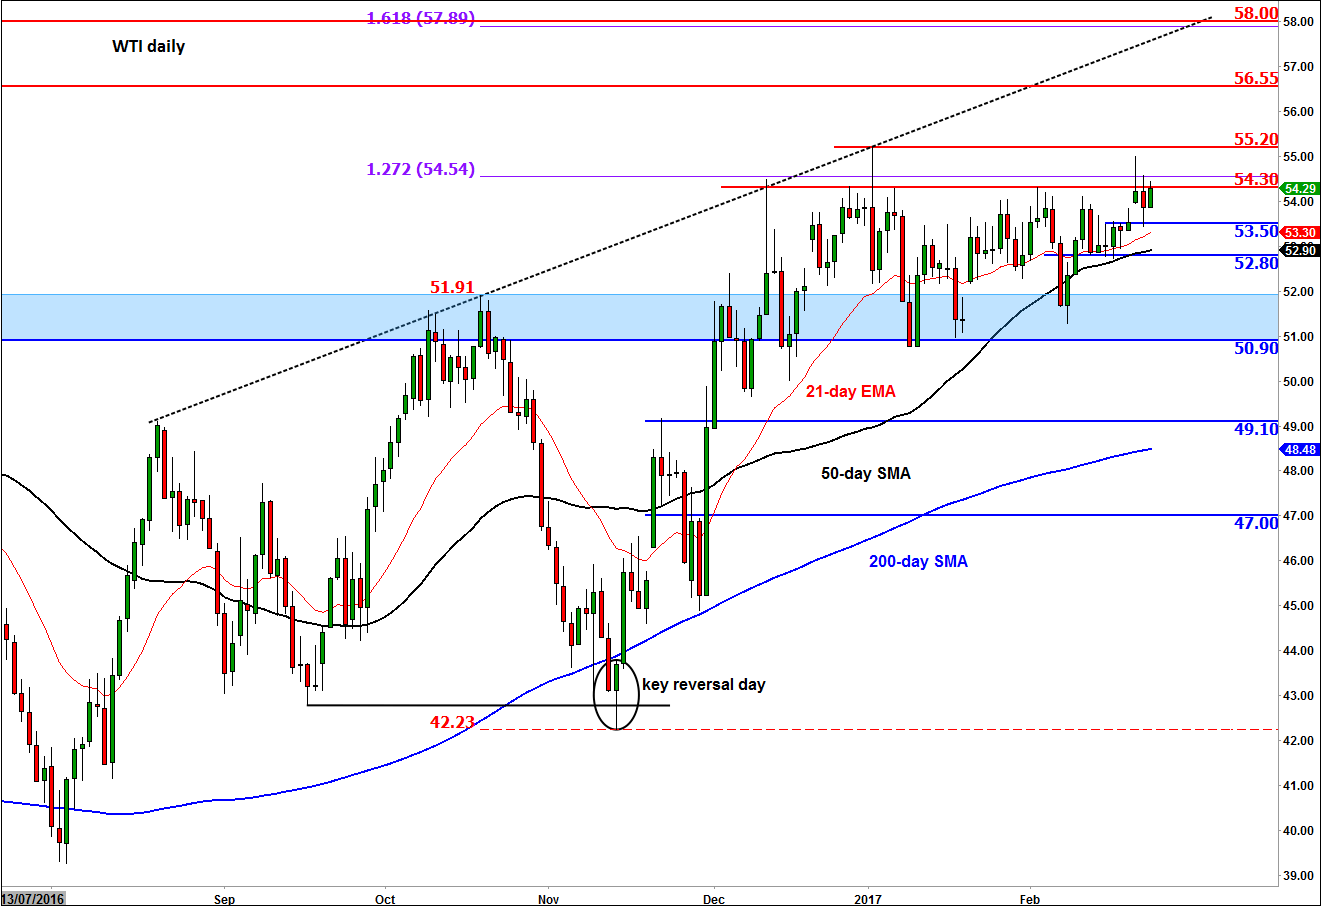
Meanwhile from a technical perspective, nothing has changed materially from my last report. The tight consolidation above last year’s key broken resistance levels suggests oil prices have been coiling to break higher. The consolidation has also allowed momentum indicators such as the Relative Strength Index and other oscillators to unwind from “overbought” thresholds mainly through time rather than price, which is again very bullish. Consequently, I am anticipating both oil contracts to break out of their recent ranges and head higher. A potential break above $58.35 on Brent could see the London-based oil contract head towards $63.00, the last support pre-breakdown back in June 2015. The corresponding bullish target for WTI is at $60. As things stand, I will only turn bearish on oil if both contracts break back below their recent ranges i.e. at $54.00 on Brent and $50.80/90 for WTI. That is unless we see other significant bearish patterns beforehand. But for now, we remain pretty much bullish and therefore think that the path of least resistance is to the upside.
Indeed, if in the short-term WTI breaks above the $54.30 resistance level on a daily closing basis then it may start heading towards $55.20 initially – the top of the current range – ahead of $56.50/5 and then $58.00. The latter marks the convergence of a previous support level with the top of a trend line and the 161.8% Fibonacci extension level of the last significant downswing pre breakout.
StoneX Financial Ltd (trading as “City Index”) is an execution-only service provider. This material, whether or not it states any opinions, is for general information purposes only and it does not take into account your personal circumstances or objectives. This material has been prepared using the thoughts and opinions of the author and these may change. However, City Index does not plan to provide further updates to any material once published and it is not under any obligation to keep this material up to date. This material is short term in nature and may only relate to facts and circumstances existing at a specific time or day. Nothing in this material is (or should be considered to be) financial, investment, legal, tax or other advice and no reliance should be placed on it.
No opinion given in this material constitutes a recommendation by City Index or the author that any particular investment, security, transaction or investment strategy is suitable for any specific person. The material has not been prepared in accordance with legal requirements designed to promote the independence of investment research. Although City Index is not specifically prevented from dealing before providing this material, City Index does not seek to take advantage of the material prior to its dissemination. This material is not intended for distribution to, or use by, any person in any country or jurisdiction where such distribution or use would be contrary to local law or regulation.
For further details see our full non-independent research disclaimer and quarterly summary.
CFDs are complex instruments and come with a high risk of losing money rapidly due to leverage. 69% of retail investor accounts lose money when trading CFDs with this provider. You should consider whether you understand how CFDs work and whether you can afford to take the high risk of losing your money. CFD and Forex Trading are leveraged products and your capital is at risk. They may not be suitable for everyone. Please ensure you fully understand the risks involved by reading our full risk warning.
City Index is a trading name of StoneX Financial Ltd. Head and Registered Office: 1st Floor, Moor House, 120 London Wall, London, EC2Y 5ET. StoneX Financial Ltd is a company registered in England and Wales, number: 05616586. Authorised and regulated by the Financial Conduct Authority. FCA Register Number: 446717.
City Index is a trademark of StoneX Financial Ltd.
The information on this website is not targeted at the general public of any particular country. It is not intended for distribution to residents in any country where such distribution or use would contravene any local law or regulatory requirement.
© City Index 2024