Crude s long term outlook remains bullish
Overnight saw crude oil extend its decline as concerns about oversupply were reinforced although prices have since rebounded ahead of the publication of the official weekly US crude inventories report later this afternoon. In its monthly report, the US Energy Information Admiration (EIA) revised upwards its estimate for US oil production because of the increased drilling activity that we have witnessed over the past several weeks. On top of this, the American Petroleum Institute (API), an industry group, reported a sharper-than-expected 2.1 million barrel rise in US weekly crude stockpiles. As a result, hopes that the official data from the EIA would reveal a 1.3 million decrease – the first decline in two weeks – were dashed.
Nevertheless, the API data also revealed sharp falls in stocks of oil products, especially gasoline (3.9 million barrels), which, if confirmed by the EIA, would imply strong demand. And while US oil production may well increase again later this year, the recent renewed weakness in oil prices means this outcome is now probably priced in. But if oil prices were to remain around their current levels, I would be very surprised to see a marked increase in production. In any case, many oil forecasters, including the EIA, expect the crude market to be undersupplied in the second half of next year. This argues against another significant drop in the price of oil. If anything, prices ‘should’ actually rise in the event of undersupply. What’s more, the surging US equity prices to record high levels point to improving economic conditions (the markets tend to lead the economy), which in turn implies even stronger demand for oil next year.
Technical outlook
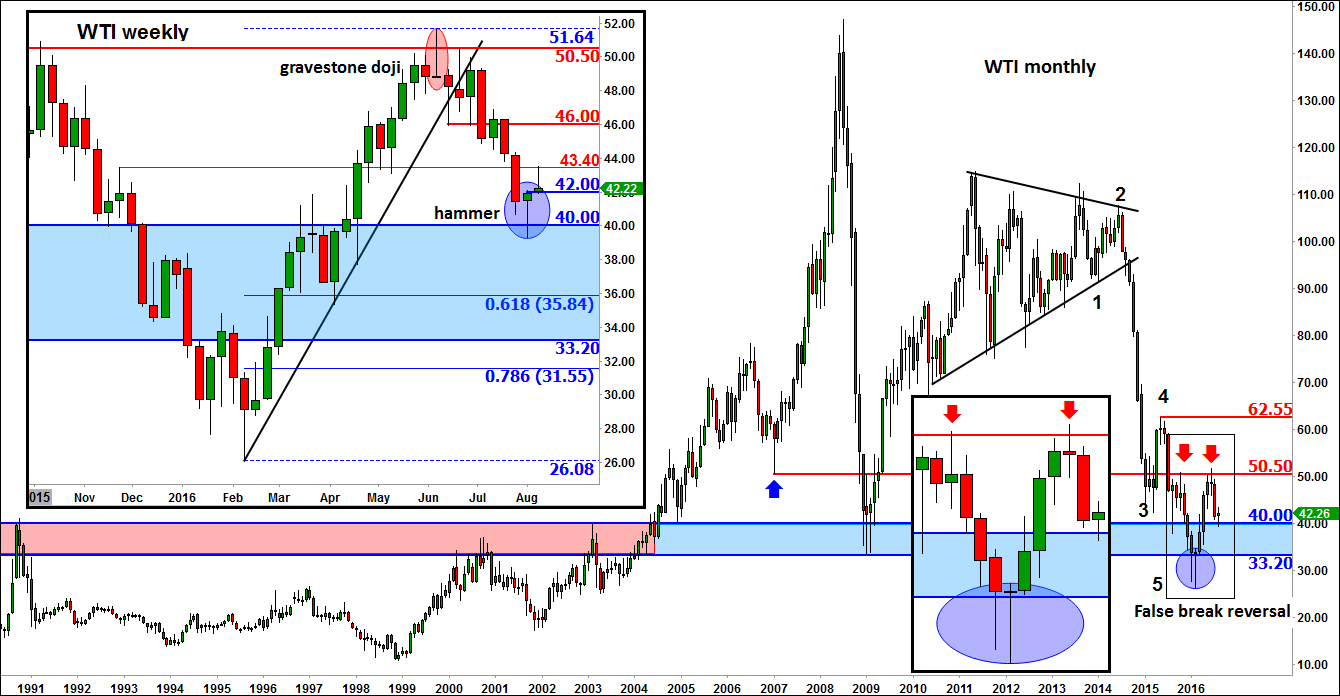
Now since I have talked about the long-term fundamental outlook, let’s remind ourselves of the long-term technicals for oil today. Below we have a monthly chart of WTI, with the weekly chart also shown in the inset. As can be seen, a bullish reversal pattern was formed in February of this year, namely a false breakout below prior low of $33.20, coupled with a doji candlestick formation on the monthly time frame. That reversal pattern obviously led to a sharp rally in the ensuing months as the shorts rushed to exit their positions and the bulls re-emerged in numbers. In the space of just a few months, the price of oil nearly doubled from its base of around $26.00 to hit a high of $51.65. These types of impulsive moves invariably pause at the very least, simply because of profit-taking. And that’s what happened at the start of the summer when oil created a bearish reversal pattern around the prior swing high of $50.50 (this also being close to the psychological level of $50). As you would expect, following its impulsive move higher, oil has since been in a corrective phase, shedding in the process more than $10. The drop of more than 20% technically means oil dropped back into the ‘official’ bear territory. But you have to put things into perspective. A 20% pullback after a near 100% rise is hardly a bearish move.
Indeed, as WTI oil remains well above its monthly reversal candle, the long-term outlook remains bullish in my view. The corrective move that began at the start of the summer has allowed the short-term oscillators to unwind from “overbought” levels, which means some momentum-based bullish traders can begin to look for new buying opportunities once again. Although oil has yet to pull back to the sweet spot of between 61.8 and 78.6 per cent retracement against its low, it may have created at least a temporary low last week. As the weekly chart in the inset shows, WTI oil formed a hammer candlestick formation when it re-tested the upper end of the long-term support range between $33.20 and $40.00. This particular candlestick pattern, when found at the lower end of a price swing, usually, but not always, precedes a reversal in the trend.
There was indeed a bit of follow-through in the buying momentum at the start of this week which ultimately failed when oil tested a short-term resistance level at $43.40. But the weakness has proved short-lived as oil is bouncing back at the time of this writing from short-term support and the top of last week’s range around $42.00.
Going forward, oil’s next move will depend on the direction of the break of short-term levels as per the weekly chart. If resistance at $43.20 gives way, which is our base case, then there is little further overhead resistance seen until $46. And if WTI then goes on to also break above $46, this could eventually lead to a revisit of the $50 handle once again (which I would then expect to break as well). Conversely, a break back below $42 would make the near-term technical outlook a little murky. And should $40 also give way then a deeper correction towards the 61.8 or 78.6 per cent retracement levels (at $35.85 and $31.55) against this year’s lows would then become likely.
StoneX Financial Ltd (trading as “City Index”) is an execution-only service provider. This material, whether or not it states any opinions, is for general information purposes only and it does not take into account your personal circumstances or objectives. This material has been prepared using the thoughts and opinions of the author and these may change. However, City Index does not plan to provide further updates to any material once published and it is not under any obligation to keep this material up to date. This material is short term in nature and may only relate to facts and circumstances existing at a specific time or day. Nothing in this material is (or should be considered to be) financial, investment, legal, tax or other advice and no reliance should be placed on it.
No opinion given in this material constitutes a recommendation by City Index or the author that any particular investment, security, transaction or investment strategy is suitable for any specific person. The material has not been prepared in accordance with legal requirements designed to promote the independence of investment research. Although City Index is not specifically prevented from dealing before providing this material, City Index does not seek to take advantage of the material prior to its dissemination. This material is not intended for distribution to, or use by, any person in any country or jurisdiction where such distribution or use would be contrary to local law or regulation.
For further details see our full non-independent research disclaimer and quarterly summary.
CFDs are complex instruments and come with a high risk of losing money rapidly due to leverage. 69% of retail investor accounts lose money when trading CFDs with this provider. You should consider whether you understand how CFDs work and whether you can afford to take the high risk of losing your money. CFD and Forex Trading are leveraged products and your capital is at risk. They may not be suitable for everyone. Please ensure you fully understand the risks involved by reading our full risk warning.
City Index is a trading name of StoneX Financial Ltd. Head and Registered Office: 1st Floor, Moor House, 120 London Wall, London, EC2Y 5ET. StoneX Financial Ltd is a company registered in England and Wales, number: 05616586. Authorised and regulated by the Financial Conduct Authority. FCA Register Number: 446717.
City Index is a trademark of StoneX Financial Ltd.
The information on this website is not targeted at the general public of any particular country. It is not intended for distribution to residents in any country where such distribution or use would contravene any local law or regulatory requirement.
© City Index 2024