Crude rally inspires technical breakdown for GBP CAD
This week’s mixed-bag UK economic data has caused the pound to fall against most major currencies, including the Canadian dollar which has managed to perform well recently despite the increased volatility in crude oil prices. The relatively strong performance of the Canadian dollar of late suggests that a bottom in crude is either in place or very close, or that the effects of oil price drops are dissipating. But it could also be due to the non-resources sector of the Canadian economy, which has performed well recently as acknowledged, for example, by the Bank of Canada.
A contingent agreement by major oil producers Russia, Saudi, Qatar and Venezuela to freeze their oil output at January levels has helped to stabilise the oil market. Having just seen its sanctions lifted, Iran obviously wants to win back market share and up until today they had rightly been against the idea of freezing their production levels. After all, why should they pay the price for something they had no part to play in? But today, the Iranian oil minister was quoted as saying “we look forward to the beginning of cooperation between OPEC and non-OPEC countries and we support any measure that can stabilise the market and increase prices,” according to Shana. So far however it is not clear if Iran will accept not to raise its production in order to prove its commitment. But it needs to make its position clear and do so quickly for oil investors to really believe that something is being done about the oil price slump. Nevertheless, it appears as though most of the major oil producing nations are willing to freeze their oil output and if this is backed up by evidence in the coming months then we could be seeing the light at the end of the tunnel soon.
Meanwhile, economic data in the UK has been mixed this week. The latest ONS data shows, for example, that UK employment continued to rise between October and December, with earnings moderating slightly. A record 31.4 million people were in work, though the rate of unemployment remained unchanged at 5.1%. Excluding bonuses, earnings rose unexpectedly to 2.0% from 1.9%, while earnings including bonuses moderated to 1.9% from 2.0% previously. The forward-looking employment indicator jobless claims, or the change in the claimant count, fell by a surprisingly large 14.8 thousand applications month-over-month in January. On Tuesday, the CPI measure of inflation for January printed 0.3% year-over-year as expected, while core CPI and RPI both disappointed. Consequently, the data has failed to change the market’s view about the outlook of UK interest rates. Many analysts expect interest rates to remain at the current historically low 0.5% rate well into 2017.
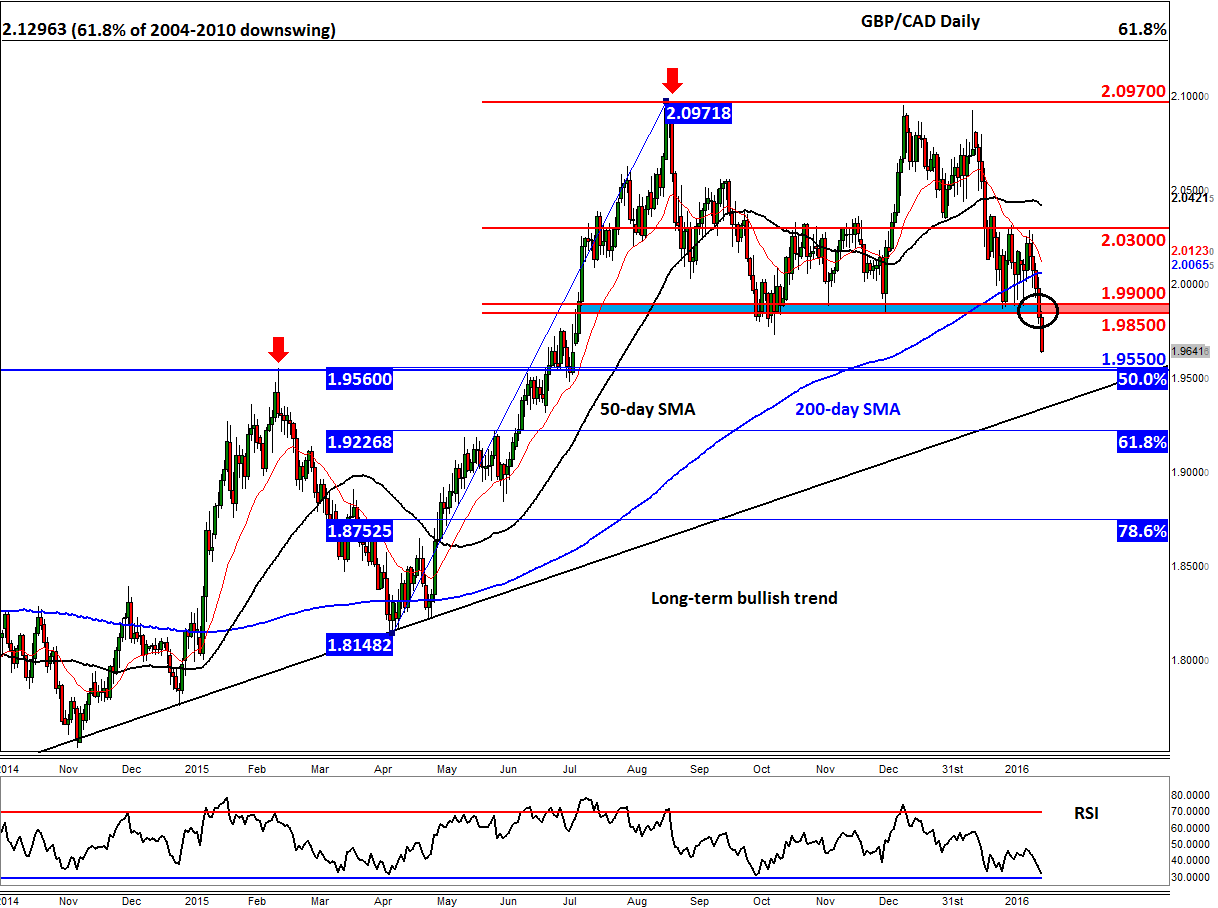
From a technical point of view, the GBP/CAD has now broken below a major support area around 1.9850-1.9900, which could pave the way for further sharp losses. Previously this area was strong support and now that we are below here, the path of least resistance is to the downside and will remain that way until proven wrong.
The selling could really gather pace if the GBP/CAD now goes on to take out further supports. In the short-term, the 1.9550/60 level should be watched closely. As well as the 50% retracement of the last upswing, this level was previously resistance. Should it get there, the GBP/CAD may stage at least a short-term bounce, so the bears need to be wary of that possibility. The more significant support is the long-term bullish trend line, currently around 1.9350.
In the event the long-term bull trend breaks down, the 61.8% Fibonacci retracement level at 1.9225 could be the next bearish target, followed by the psychologically-important 1.90 handle. Meanwhile a potential rally back above the 1.9850-1.9900 area would completely invalidate this bearish setup. In this scenario, the cross could rally back towards its 200-day SMA around 2.0000 or previous resistance circa 2.0300.
StoneX Financial Ltd (trading as “City Index”) is an execution-only service provider. This material, whether or not it states any opinions, is for general information purposes only and it does not take into account your personal circumstances or objectives. This material has been prepared using the thoughts and opinions of the author and these may change. However, City Index does not plan to provide further updates to any material once published and it is not under any obligation to keep this material up to date. This material is short term in nature and may only relate to facts and circumstances existing at a specific time or day. Nothing in this material is (or should be considered to be) financial, investment, legal, tax or other advice and no reliance should be placed on it.
No opinion given in this material constitutes a recommendation by City Index or the author that any particular investment, security, transaction or investment strategy is suitable for any specific person. The material has not been prepared in accordance with legal requirements designed to promote the independence of investment research. Although City Index is not specifically prevented from dealing before providing this material, City Index does not seek to take advantage of the material prior to its dissemination. This material is not intended for distribution to, or use by, any person in any country or jurisdiction where such distribution or use would be contrary to local law or regulation.
For further details see our full non-independent research disclaimer and quarterly summary.
CFDs are complex instruments and come with a high risk of losing money rapidly due to leverage. 69% of retail investor accounts lose money when trading CFDs with this provider. You should consider whether you understand how CFDs work and whether you can afford to take the high risk of losing your money. CFD and Forex Trading are leveraged products and your capital is at risk. They may not be suitable for everyone. Please ensure you fully understand the risks involved by reading our full risk warning.
City Index is a trading name of StoneX Financial Ltd. Head and Registered Office: 1st Floor, Moor House, 120 London Wall, London, EC2Y 5ET. StoneX Financial Ltd is a company registered in England and Wales, number: 05616586. Authorised and regulated by the Financial Conduct Authority. FCA Register Number: 446717.
City Index is a trademark of StoneX Financial Ltd.
The information on this website is not targeted at the general public of any particular country. It is not intended for distribution to residents in any country where such distribution or use would contravene any local law or regulatory requirement.
© City Index 2024