Crude on slippery slope again keys levels being tested
Brent oil has almost given up the entire gains made in the second half of last week and is down about 3% today. WTI is holding its own relatively well, though it too is sharply lower at the time of this writing. Brent’s underperformance is undoubtedly because of the latest Chinese data which points to continued slowdown in economic growth there, and in turn oil demand, and news that the Iran’s nuclear deal has been formally adopted, bringing the day when Tehran is expected to flood the already-saturated oil market with fresh supplies a step closer.
The fact that economic growth in China slowed down to its slowest pace since 2009 of 6.9% in the third quarter was hardly a surprise as we had already seen consistent weakness in incoming data throughout Q3 – if anything it was actually a positive surprise as the market was anticipating an even weaker number. But the more fresh and less backward-looking data including fixed asset investment and, more importantly, industrial production actually deviated from expectations by a significant margin – with the latter printing a year-over-year reading of 5.7% for September versus expectations of 6.0% and compared to 6.1% in August. The disappointing industrial data has raised concerns that China will fail to meet its 7% growth rate target this year. While equity markets investors have taken this a sign that more easing measures will be introduced by the PBOC, participants in the commodity markets have obviously shown some disappointment with oil, copper, silver and gold prices all falling.
In the case of oil, news that Iran and the West have reached the “adoption day” agreement is an additional force weighing on prices as this has paved the way for sanctions relief to begin on “implementation day,” which is when the International Atomic Energy Agency (IAEA) certifies that Tehran has stuck to its commitments to curb its nuclear programme. “From the first day that nuclear agreement is implemented and sanctions are lifted, Iran will increase its exports,” so says Iran’s energy minister Bijan Namdar Zanganeh. The country could increase its production by 500,000 barrels per day immediately after sanctions are lifted and according to Zanganeh, output could reach its pre-sanctions levels of about 3.4 million barrels per day within seven months. In other words, the global oil market is set to remain more than amply supplied in 2016.
So where might oil find support from? A good place to start would be the expected reduction in US shale oil supply. Here, the latest signs are promising, with the Baker Hughes data showing an additional fall of 10 in oil rigs last week. This means that US drilling activity is now at its lowest level since July 2010. In addition, most of the bearish news for oil might already be priced in; thus, there is so much further oil can fall from these depressed levels. Indeed, if oil traders manage to shrug off the latest weakness in macro data and renewed fears about excessive supply, then this should be taken as a sign for things to come.
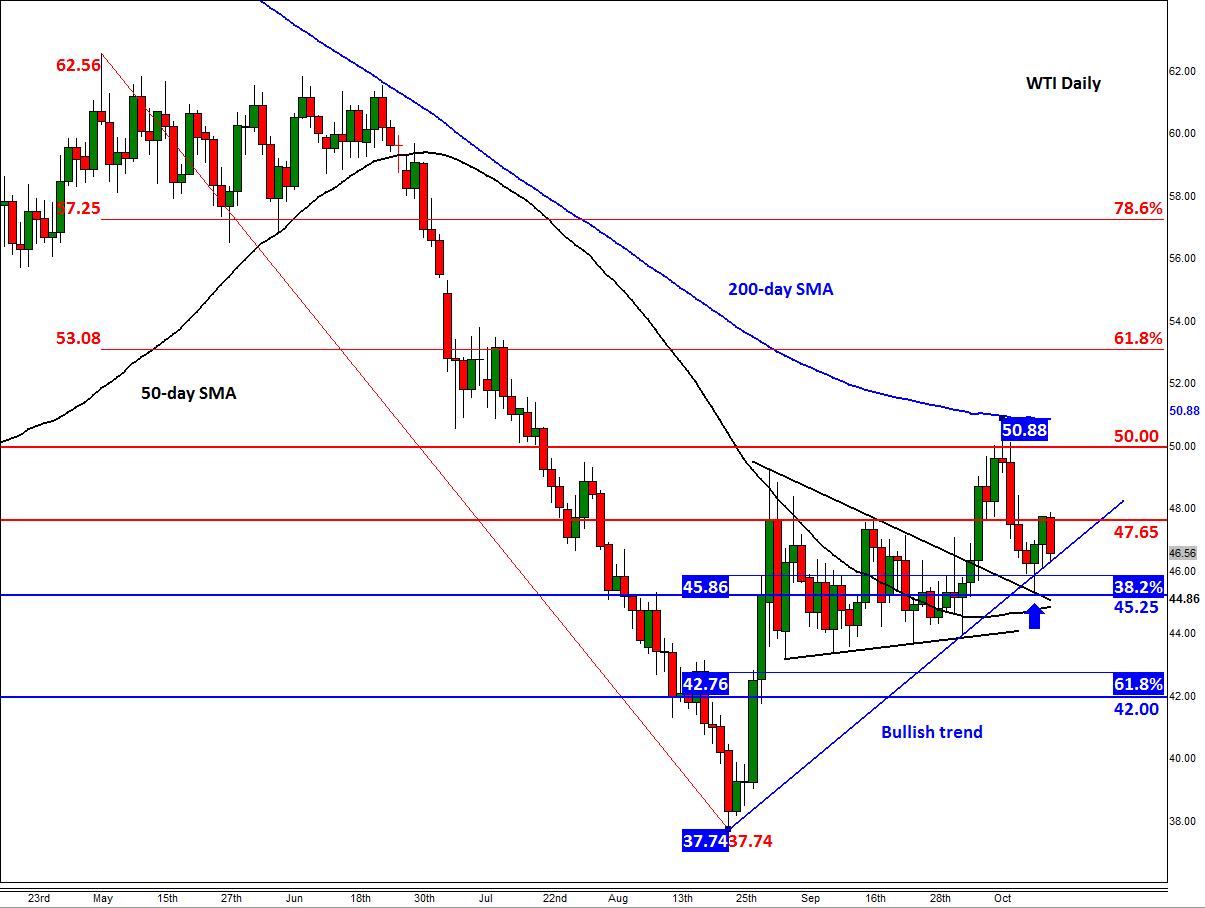
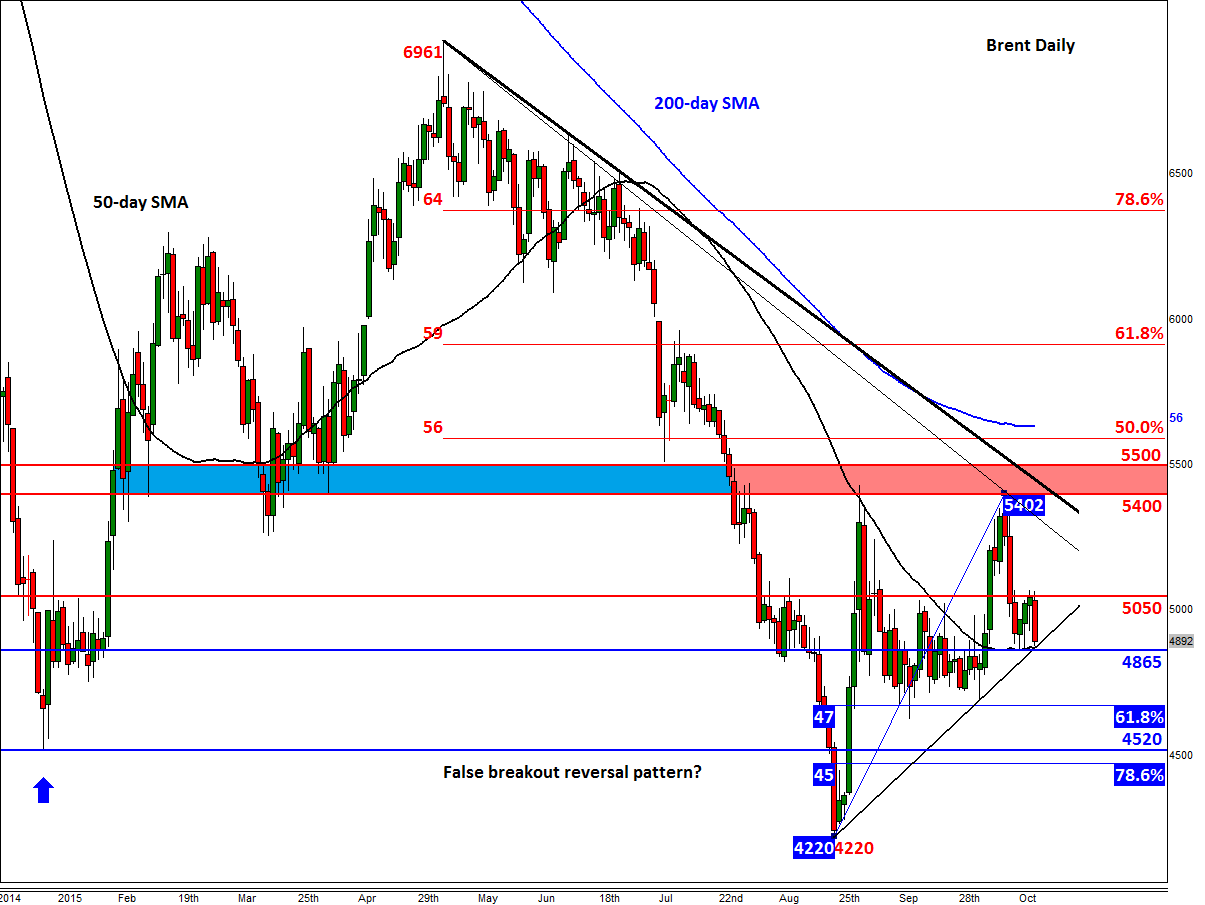
Though the most recent price action might feel and suggest otherwise, it could be that a bottom has already been formed for oil at the end of August when the price of Brent momentarily dropped to about $42 and WTI fell below $38 a barrel. If so, we should see some buying activity each time prices pull back by noticeable amounts, especially around important technical support levels. With that in mind, Brent is testing a key level around $48.65 which is where the 50-day moving average meets a short-term bullish trend line. WTI is likewise testing its own bullish trend line around $46.40 at the time of this writing. The latter actually formed some bullish-looking price action at the end of last week when it bounced strongly off the top of its former triangle pattern. Another rebound from these levels will be further confirmation for the bulls. However, if the bears reclaim the support levels just mentioned then oil prices could sharply extend their declines this week, with the next support for Brent not seen until $46.75 (61.8% Fibonacci retracement against the recent low), followed $45.20.
StoneX Financial Ltd (trading as “City Index”) is an execution-only service provider. This material, whether or not it states any opinions, is for general information purposes only and it does not take into account your personal circumstances or objectives. This material has been prepared using the thoughts and opinions of the author and these may change. However, City Index does not plan to provide further updates to any material once published and it is not under any obligation to keep this material up to date. This material is short term in nature and may only relate to facts and circumstances existing at a specific time or day. Nothing in this material is (or should be considered to be) financial, investment, legal, tax or other advice and no reliance should be placed on it.
No opinion given in this material constitutes a recommendation by City Index or the author that any particular investment, security, transaction or investment strategy is suitable for any specific person. The material has not been prepared in accordance with legal requirements designed to promote the independence of investment research. Although City Index is not specifically prevented from dealing before providing this material, City Index does not seek to take advantage of the material prior to its dissemination. This material is not intended for distribution to, or use by, any person in any country or jurisdiction where such distribution or use would be contrary to local law or regulation.
For further details see our full non-independent research disclaimer and quarterly summary.
CFDs are complex instruments and come with a high risk of losing money rapidly due to leverage. 69% of retail investor accounts lose money when trading CFDs with this provider. You should consider whether you understand how CFDs work and whether you can afford to take the high risk of losing your money. CFD and Forex Trading are leveraged products and your capital is at risk. They may not be suitable for everyone. Please ensure you fully understand the risks involved by reading our full risk warning.
City Index is a trading name of StoneX Financial Ltd. Head and Registered Office: 1st Floor, Moor House, 120 London Wall, London, EC2Y 5ET. StoneX Financial Ltd is a company registered in England and Wales, number: 05616586. Authorised and regulated by the Financial Conduct Authority. FCA Register Number: 446717.
City Index is a trademark of StoneX Financial Ltd.
The information on this website is not targeted at the general public of any particular country. It is not intended for distribution to residents in any country where such distribution or use would contravene any local law or regulatory requirement.
© City Index 2024