Crude on a slippery rollercoaster ride to nowhere
Over the past week and a half, crude oil prices have been on a rollercoaster ride. Within the large ranges, the force of gravity has generally worked against bullish speculators after the 3-week rally ended in mid-August when Brent hit $51 and WTI reached $49 a barrel again. The two oil contracts now find themselves at $48.20 and $45.95 a barrel, respectively. Still, compared to the lows of around $41.50 and $39.50 at the start of the month, August has been a good month for both oil contracts – provided we don’t see a vicious sell-off later on in the session when the US weekly oil report is published. To some degree, oil’s performance since the middle of the month can be explained away by the impact of the dollar, which has bounced back sharply during this period. As crude oil is denominated in the dollar, this makes it more expensive for holders of other currencies when the greenback appreciates. But the impact of the dollar on oil should be temporary, especially given that the price elasticity of demand for crude is considered relatively inelastic. Therefore, if the dollar were to appreciate significantly now as a result of further improvement in US data and a resulting rate rise from the Fed, crude oil may not necessarily go in the opposite direction. After all, the potential improvement in US economy would also imply stronger demand for oil.
When you ignore the short-term flections in oil prices due to the movements in the US dollar, the fundamentals for crude oil from an actual supply and demand point of view becomes a lot clearer. On this front, little progress has been made however. Clearly, many speculators are now just waiting to find out whether Saudi Arabia and other members of the OPEC will agree next month to a production freeze deal with some non-OPEC producers, led by Russia. Both Iran and Iraq have come out in recent days, stating that that they support the idea of an output freeze…as long as it doesn’t impact their own pursuit of market share! If these important OPEC members go into the meeting with that sort of mentality, I would be very surprised to see any sort of agreement being achieved. So the potential is there for a sharp drop in this scenario, but like the previous case earlier this year, the downside could well be limited due to on-going expectations that the market will tighten anyway as US shale output declines further and demand rises.
But in the short-term outlook, oil is likely to find direction from the latest US oil stockpiles report and as mentioned the direction of the US dollar. Last night, the American Petroleum Institute (API) reported that US oil inventories rose by a less-than-expected 942,000 barrels last week, while Cushing stocks declined by 620,000 barrels and gasoline by 1.6 million barrels. However, the report wasn’t considered bullish enough to support WTI oil prices, possibly because of the fact there was a huge build in stocks of distillates which rose by 3 million barrels. The official report from the US Department of Energy’s EIA is due out at 15:30 BST (10:30 ET). It will need to first and foremost confirm the declines in Cushing crude and gasoline stocks. If the report also shows that the overall build in US oil stocks was less than that reported by the API, or better still, a drawdown then we could see oil prices bounce back.
Technical outlook
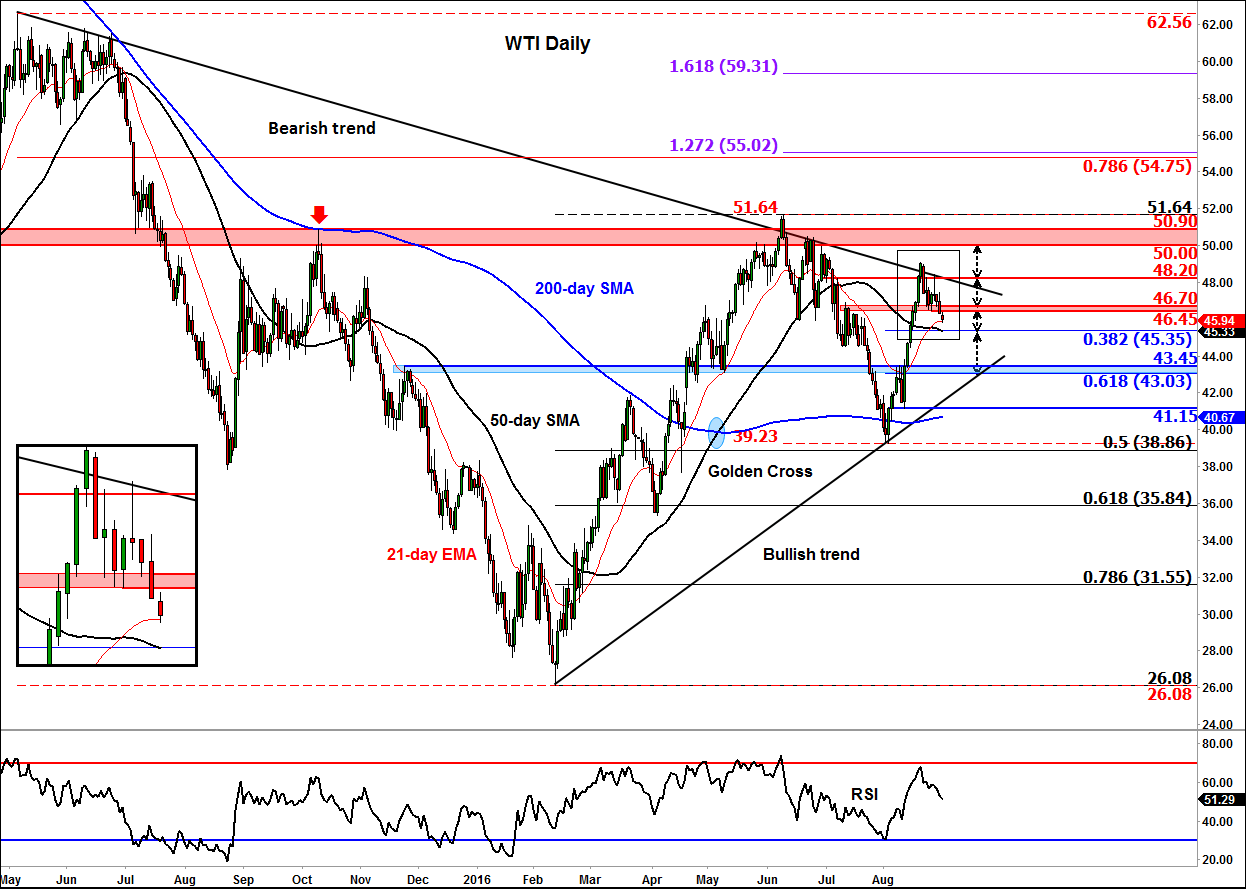
WTI’s daily chart shows oil prices are basically stuck in consolidation. The fact that WTI is currently sitting above its main moving averages objectively shows that the trend has been bullish relative to the average of the past 21, 50 and 200 days. What’s more, the 200-day moving average is now pointing higher, meaning that long-term trend is also objectively turning bullish. Thus, oil’s recent hesitation could just turn out to be a short-term pullback inside the larger bullish fractal. In the short-term though oil could fall further, especially if the prior support in the $46.45-46.70 range holds as resistance now. A couple of the near-term downside targets include the convergence of the 50-day moving average with the 38.2% Fibonacci retracement level of the upswing from August’s low at $45.30/5, followed by the prior resistance and the 61.8% Fibonacci level around the $43.00/43.45 area (shaded in light blue on the chart). But if and when the aforementioned resistance at $46.45/70 area breaks then there is a possibility we will see a sharp rally, with the first objective being the bearish trend line and the prior high at around $48.20/45. The longer-term key resistance zone is between the psychological level of $50 and the prior resistance around $50.90, an area which needs to be cleared if we are to see some eye-catching gains in the coming months.
StoneX Financial Ltd (trading as “City Index”) is an execution-only service provider. This material, whether or not it states any opinions, is for general information purposes only and it does not take into account your personal circumstances or objectives. This material has been prepared using the thoughts and opinions of the author and these may change. However, City Index does not plan to provide further updates to any material once published and it is not under any obligation to keep this material up to date. This material is short term in nature and may only relate to facts and circumstances existing at a specific time or day. Nothing in this material is (or should be considered to be) financial, investment, legal, tax or other advice and no reliance should be placed on it.
No opinion given in this material constitutes a recommendation by City Index or the author that any particular investment, security, transaction or investment strategy is suitable for any specific person. The material has not been prepared in accordance with legal requirements designed to promote the independence of investment research. Although City Index is not specifically prevented from dealing before providing this material, City Index does not seek to take advantage of the material prior to its dissemination. This material is not intended for distribution to, or use by, any person in any country or jurisdiction where such distribution or use would be contrary to local law or regulation.
For further details see our full non-independent research disclaimer and quarterly summary.
CFDs are complex instruments and come with a high risk of losing money rapidly due to leverage. 69% of retail investor accounts lose money when trading CFDs with this provider. You should consider whether you understand how CFDs work and whether you can afford to take the high risk of losing your money. CFD and Forex Trading are leveraged products and your capital is at risk. They may not be suitable for everyone. Please ensure you fully understand the risks involved by reading our full risk warning.
City Index is a trading name of StoneX Financial Ltd. Head and Registered Office: 1st Floor, Moor House, 120 London Wall, London, EC2Y 5ET. StoneX Financial Ltd is a company registered in England and Wales, number: 05616586. Authorised and regulated by the Financial Conduct Authority. FCA Register Number: 446717.
City Index is a trademark of StoneX Financial Ltd.
The information on this website is not targeted at the general public of any particular country. It is not intended for distribution to residents in any country where such distribution or use would contravene any local law or regulatory requirement.
© City Index 2024