Crude oil weakness likely to be short lived
Buck-denominated crude oil prices fell sharply on Friday, along with gold and silver after the slightly stronger US jobs report gave the dollar what looks like a temporary boost. In addition, doubts continued over the potential oil-freeze deal between large OPEC members and Russia, which may help explain why – as CFTC data showed – money managers and hedge funds had trimmed their bullish positions on WTI for the first time in six weeks and increased bearish bets by the most since November in the week ending March 29. In truth, profit-taking after the very strong rally may be the number one reason for this, for nothing has changed fundamentally. Iran has once again re-iterated that it will continue increasing production and exports. The country rightly wants to boost its output near the levels it had been before nuclear-related economic sanctions were imposed and is therefore not interested in any deal to curb its output in the short-term. This is a big problem for some of the other large OPEC producers in the Middle East region as they do not want to give away market share by agreeing to limit their output to January levels, which was near record levels anyway. Russia’s oil output has meanwhile increased to the highest level in 30 years. But previous remarks from various oil ministers had suggested that a deal may be agreed upon with or without Iran’s participation. It is a perilous situation, but ultimately there is a consensus that something needs to be done. When there is a will there is always a way and so I think some sort of a deal will be ultimately reached.
But for now global crude oil supply remains more than required which is continuing to exert downward pressure on prices. However, most of the negative news is in the price and for oil prices to weaken materially, something big would have to happen now. In fact, US crude output is continuing to decline and the latest fall in the oil rig counts, down another 10 to 362 in the week ending April 1, means production there is likely to fall further in the months to come. Given this backdrop, and the potential for an oil-freeze deal this month, the global supply-demand imbalance is likely to fade as we progress towards the latter parts of this year. As such, oil prices look poised to recover further.
Technical outlook: Brent
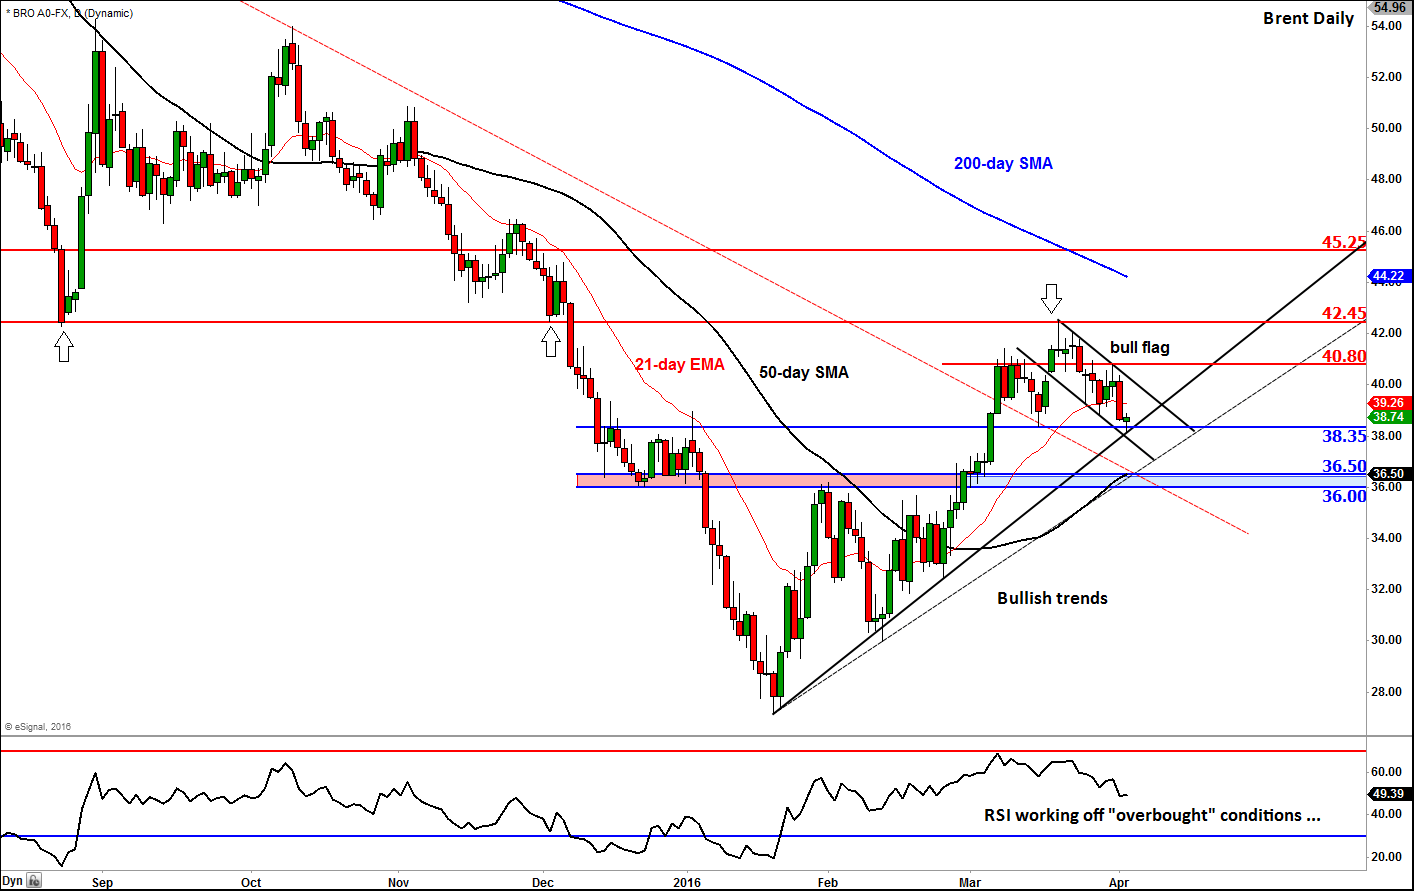
Since peaking at key resistance of around $42.45/50 on March 18, the price of Brent oil has been generally trending lower. As the daily chart shows, below, this was previously a key support area. It was therefore very likely that after such a strong recovery, Brent would find some resistance there – not just because of profit taking, but also due to some selling pressure. The resulting price action on that day helped to form a doji candle at the top of the trend, correctly signalling that the rally had halted there. But is this just a short-term pullback or the start of another major leg lower?
As things stand, one would have to treat the recent weakness in Brent oil as a short-term pullback rather than the start of a new downward trend. Although oil may still be below the still-downward-sloping 200-day moving average, the 50-day average has recently turned higher. Meanwhile a couple of bullish trend lines have also been established, some major resistance levels have broken down and price has formed higher lows and a higher high, too. Only when these bullish trend lines or the key support area around $36.00/50 area breaks would I change my opinion. In fact, the pause here may well be a healthy development as far as the longer term outlook is concerned as it allows the short-term momentum indicators to unwind and work off “overbought” conditions before price stages another potential rally.
At the time of this writing, Brent had bounced off a key horizontal support level around $38.35, after hitting a low at $38.15 – a level which corresponds with the first of the two bullish trend lines as shown on the chart. Though this in itself is not necessarily a bullish development, oil traders may want to watch closely what happens next. If and when Brent breaks out of the bullish continuation flag pattern to the upside and takes out short-term resistance at $40.80 then that may be a sign that the rally has resumed. In this potential scenario, at least a revisit of the previous support-turned-resistance at $42.45/50 would become highly likely. However, if Brent breaks below today’s earlier low then we may see the oil price drop to the next bullish trend line or even all the way to the next key support around the $36.00/50 area before it makes its next move. So, it could be an important day for Brent as far as the technical are concerned.
Source: eSignal and FOREX.com.
StoneX Financial Ltd (trading as “City Index”) is an execution-only service provider. This material, whether or not it states any opinions, is for general information purposes only and it does not take into account your personal circumstances or objectives. This material has been prepared using the thoughts and opinions of the author and these may change. However, City Index does not plan to provide further updates to any material once published and it is not under any obligation to keep this material up to date. This material is short term in nature and may only relate to facts and circumstances existing at a specific time or day. Nothing in this material is (or should be considered to be) financial, investment, legal, tax or other advice and no reliance should be placed on it.
No opinion given in this material constitutes a recommendation by City Index or the author that any particular investment, security, transaction or investment strategy is suitable for any specific person. The material has not been prepared in accordance with legal requirements designed to promote the independence of investment research. Although City Index is not specifically prevented from dealing before providing this material, City Index does not seek to take advantage of the material prior to its dissemination. This material is not intended for distribution to, or use by, any person in any country or jurisdiction where such distribution or use would be contrary to local law or regulation.
For further details see our full non-independent research disclaimer and quarterly summary.
CFDs are complex instruments and come with a high risk of losing money rapidly due to leverage. 69% of retail investor accounts lose money when trading CFDs with this provider. You should consider whether you understand how CFDs work and whether you can afford to take the high risk of losing your money. CFD and Forex Trading are leveraged products and your capital is at risk. They may not be suitable for everyone. Please ensure you fully understand the risks involved by reading our full risk warning.
City Index is a trading name of StoneX Financial Ltd. Head and Registered Office: 1st Floor, Moor House, 120 London Wall, London, EC2Y 5ET. StoneX Financial Ltd is a company registered in England and Wales, number: 05616586. Authorised and regulated by the Financial Conduct Authority. FCA Register Number: 446717.
City Index is a trademark of StoneX Financial Ltd.
The information on this website is not targeted at the general public of any particular country. It is not intended for distribution to residents in any country where such distribution or use would contravene any local law or regulatory requirement.
© City Index 2024