Crude oil uptrend has reached critical resistance
This week has seen a renewed upsurge for crude oil prices sparked by several unexpected events and news that have helped alleviate ongoing oversupply concerns, at least temporarily. Factors contributing to this rise included: wildfires in Canada that have dramatically disrupted Canadian oil production, a report by the US Energy Information Administration of an unexpectedly large decrease (-3.4 million barrels) in US crude oil inventories, and a rise in the global oil demand forecast for 2016 to 1.2 million barrels per day by the International Energy Agency.
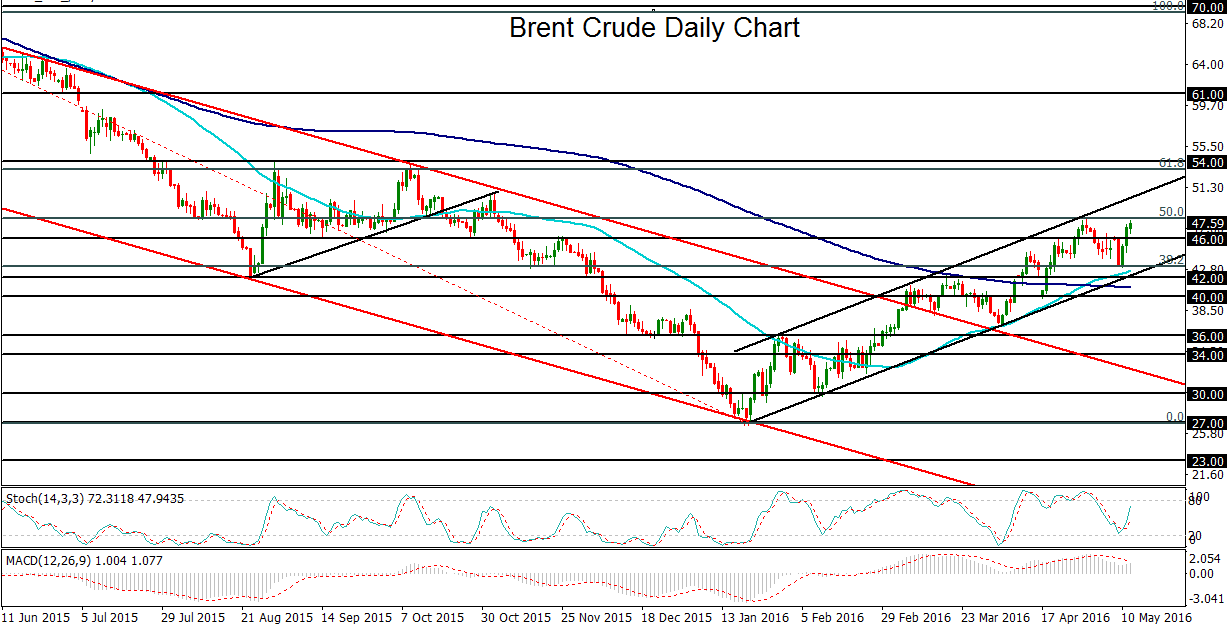
Aside from these very recent events, crude oil prices have generally been rising in a sharp uptrend channel since January as US oil production has slowed substantially. This rise has occurred despite continued high output from OPEC countries and other major oil producers, who failed last month to reach any agreement on a proposed deal to coordinate an oil production cap.
For the Brent crude oil benchmark, this week’s rebound and rise after the previous week of pullback has brought the price of oil back up to approach a major technical resistance area at $48 per barrel. This level was last reached in late February, when Brent established a new 5-month high at the top of the noted uptrend channel. The $48 level also represents the 50% Fibonacci retracement of the prolonged slide from the $70-area highs in May of last year down to January’s lows around $27. During the course of the sharp uptrend and recovery since those January lows, Brent’s 50-day moving average formed a technical “golden cross” in late April by moving above its 200-day moving average, suggesting continued bullish momentum.
Within the context of this strong uptrend momentum, however, the $48 resistance level continues to pose a key technical obstacle to a further rise. If price is able to make a strong and sustained breakout above this $48 obstacle, it could open the way towards the next major upside target at the key $54 resistance area. In the event that the $48 resistance level holds, however, Brent crude could potentially sustain a swift and sharp retreat back down towards the major $42 support level.
StoneX Financial Ltd (trading as “City Index”) is an execution-only service provider. This material, whether or not it states any opinions, is for general information purposes only and it does not take into account your personal circumstances or objectives. This material has been prepared using the thoughts and opinions of the author and these may change. However, City Index does not plan to provide further updates to any material once published and it is not under any obligation to keep this material up to date. This material is short term in nature and may only relate to facts and circumstances existing at a specific time or day. Nothing in this material is (or should be considered to be) financial, investment, legal, tax or other advice and no reliance should be placed on it.
No opinion given in this material constitutes a recommendation by City Index or the author that any particular investment, security, transaction or investment strategy is suitable for any specific person. The material has not been prepared in accordance with legal requirements designed to promote the independence of investment research. Although City Index is not specifically prevented from dealing before providing this material, City Index does not seek to take advantage of the material prior to its dissemination. This material is not intended for distribution to, or use by, any person in any country or jurisdiction where such distribution or use would be contrary to local law or regulation.
For further details see our full non-independent research disclaimer and quarterly summary.
CFDs are complex instruments and come with a high risk of losing money rapidly due to leverage. 69% of retail investor accounts lose money when trading CFDs with this provider. You should consider whether you understand how CFDs work and whether you can afford to take the high risk of losing your money. CFD and Forex Trading are leveraged products and your capital is at risk. They may not be suitable for everyone. Please ensure you fully understand the risks involved by reading our full risk warning.
City Index is a trading name of StoneX Financial Ltd. Head and Registered Office: 1st Floor, Moor House, 120 London Wall, London, EC2Y 5ET. StoneX Financial Ltd is a company registered in England and Wales, number: 05616586. Authorised and regulated by the Financial Conduct Authority. FCA Register Number: 446717.
City Index is a trademark of StoneX Financial Ltd.
The information on this website is not targeted at the general public of any particular country. It is not intended for distribution to residents in any country where such distribution or use would contravene any local law or regulatory requirement.
© City Index 2024