Crude oil surges but talk of a bottom premature at this stage
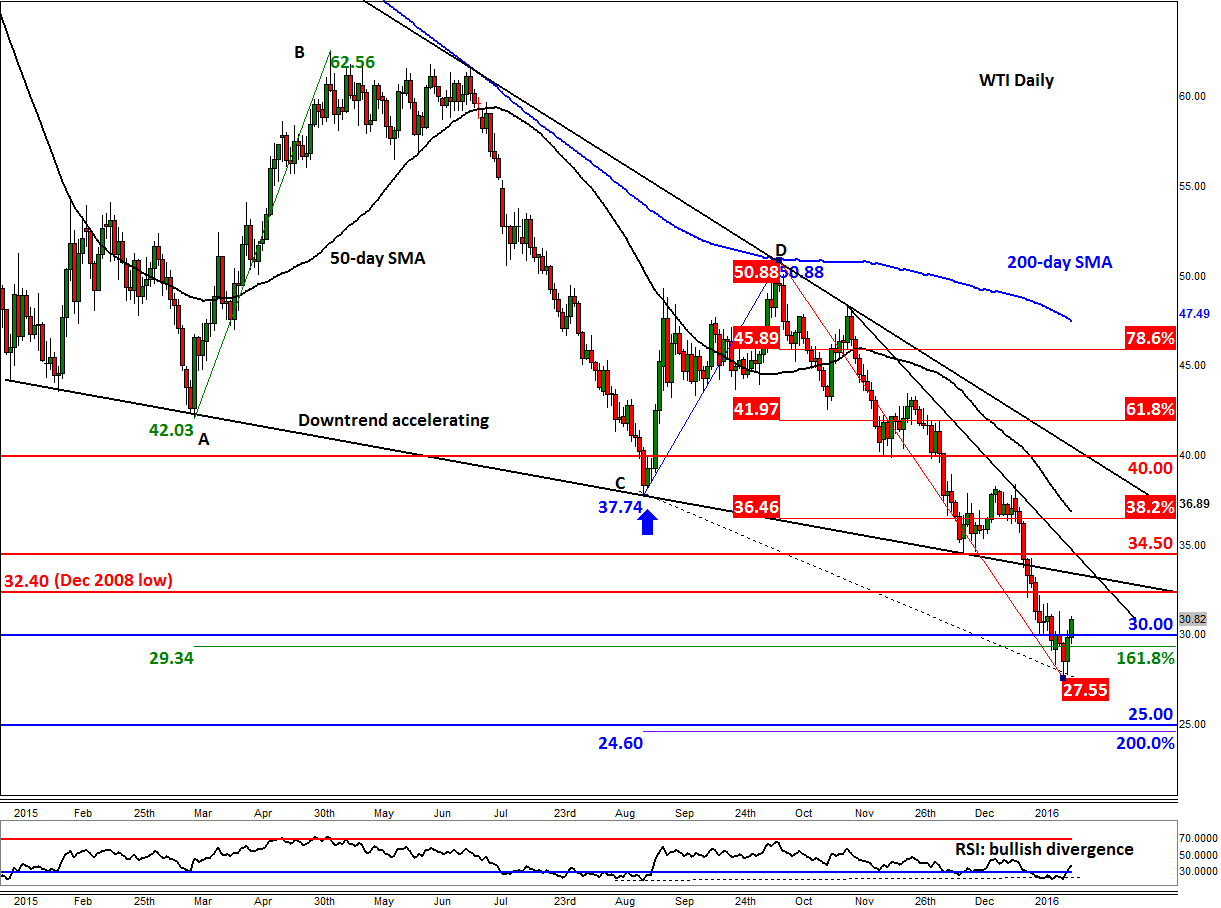
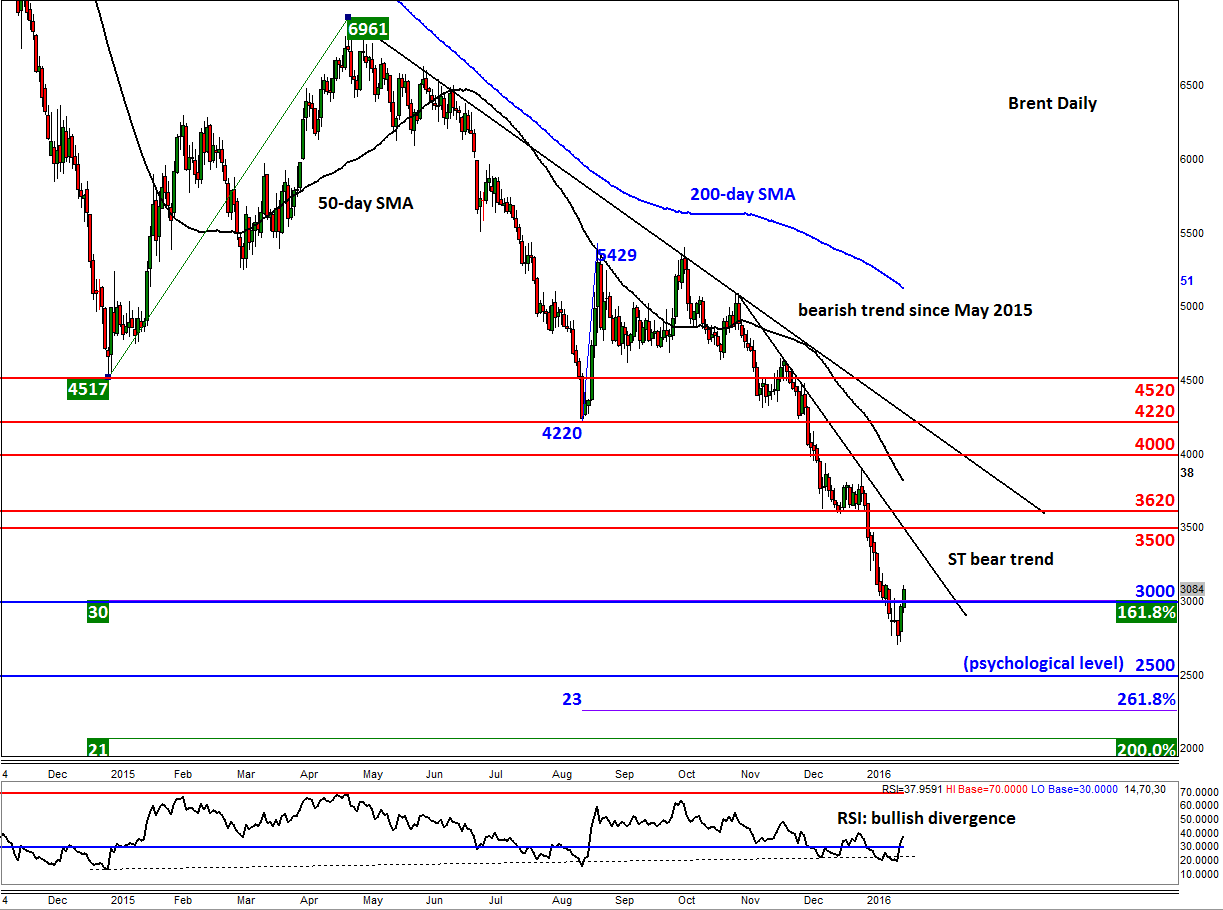
The price of crude oil has managed to rally significantly in percentage terms since hitting a low sub $28 in mid-week. Since Brent hit a low of $27.10 and WTI $27.50 on Wednesday, the two major oil contracts were some 13-15 per cent better off at the time of this writing on Friday morning. In nominal terms, the gains have been about 4 dollars thus far – although noticeable, $4 merely represents a drop in the ocean compared to how much prices have fallen over the past year or so. This sort of a move is not uncommon in strong bearish trends and suggestions that a bottom has been reached may be a bit premature at this stage as after all the fundamental picture has not improved whatsoever. That being said, the rally back above the $30 handle is clearly a bullish outcome as far as the near-term outlook is concerned.
The mid-week reversal has been driven first and foremost by traders taking profit on their exiting short positions at extremely oversold levels. Some speculators were undoubtedly uncomfortable selling oil below $30 following the significant acceleration in the downtrend in recent weeks and given that most of the bearish news was already out there (Iran, oversupply, China worries, etc.). This group of traders may show their hands again now that oil prices have staged a bit of a recovery – but probably not after the emergence of a clear technical signal that would suggest the downward trend is or about to resume. Likewise, the opportunistic buyers are unlikely to bet that prices will stage a significant recovery (in nominal terms), so they may take profit quicker since they are going against the underlying bearish trend. The net impact may be that oil prices will soon stall before not only revisiting their recent lows, but potentially breaking further lower over time.
Only when it becomes clear that the downward trend has ended will more buyers likely to step in. So far, I am not convinced that a bottom has been formed for oil. In fact, we will never know for sure; we can only have at best a calculated guess based on some fundamental story that’s not yet perceived by the majority of the market participants. This is where technical analysis come particularly handy. Traders should look for signs they are familiar with at market extremes. For example, when the market does not handle the news in the way you would expect it to. Say, if some particularly bearish news comes out for oil out but prices fail to move decisively lower or better still, rally. This would tell us that most of the bad news is already priced in. Or, we witness a big rally from extremely oversold levels, preferably around a psychologically-important price level such as $20 or $30 in the case of oil. Better still would be to wait for a major reversal pattern to form such as a false breakdown, an inverse head and shoulders or a bull/bear battle, especially around extremely oversold and psychological levels. Taking all these factors into consideration, the recent price action on oil may suggest that it has bottomed out, but at this stage it cannot be confirmed with a high degree of confidence. In fact, this isn’t the first time prices have behaved this way (and it probably won’t be the last) only for the gains to evaporate in no time.
So, it could be that a short-term low has been formed, but with the bearish trends on both contracts still intact traders should proceed with extreme caution. Price action around technically-important resistance levels should be observed closely, for the kick-back rally could end there. But if these key levels only hold down price for a small period of time then one should expect the rally to continue for some time yet. In any event, the key short-term levels to watch for WTI include $32.40, the lows from December 2008 which was taken out with ease earlier this month; $34.50 which was previously support and where a short-term bearish trend line comes into play, and $36.50/37.00, the convergence of the 38.2% Fibonacci level with the 50-day moving average. For Brent, the corresponding bearish trend line comes in around $35, so there is a potential for a sizeable recovery from current prices. For both contracts, a move back below $30 would be a bearish development.
StoneX Financial Ltd (trading as “City Index”) is an execution-only service provider. This material, whether or not it states any opinions, is for general information purposes only and it does not take into account your personal circumstances or objectives. This material has been prepared using the thoughts and opinions of the author and these may change. However, City Index does not plan to provide further updates to any material once published and it is not under any obligation to keep this material up to date. This material is short term in nature and may only relate to facts and circumstances existing at a specific time or day. Nothing in this material is (or should be considered to be) financial, investment, legal, tax or other advice and no reliance should be placed on it.
No opinion given in this material constitutes a recommendation by City Index or the author that any particular investment, security, transaction or investment strategy is suitable for any specific person. The material has not been prepared in accordance with legal requirements designed to promote the independence of investment research. Although City Index is not specifically prevented from dealing before providing this material, City Index does not seek to take advantage of the material prior to its dissemination. This material is not intended for distribution to, or use by, any person in any country or jurisdiction where such distribution or use would be contrary to local law or regulation.
For further details see our full non-independent research disclaimer and quarterly summary.
CFDs are complex instruments and come with a high risk of losing money rapidly due to leverage. 69% of retail investor accounts lose money when trading CFDs with this provider. You should consider whether you understand how CFDs work and whether you can afford to take the high risk of losing your money. CFD and Forex Trading are leveraged products and your capital is at risk. They may not be suitable for everyone. Please ensure you fully understand the risks involved by reading our full risk warning.
City Index is a trading name of StoneX Financial Ltd. Head and Registered Office: 1st Floor, Moor House, 120 London Wall, London, EC2Y 5ET. StoneX Financial Ltd is a company registered in England and Wales, number: 05616586. Authorised and regulated by the Financial Conduct Authority. FCA Register Number: 446717.
City Index is a trademark of StoneX Financial Ltd.
The information on this website is not targeted at the general public of any particular country. It is not intended for distribution to residents in any country where such distribution or use would contravene any local law or regulatory requirement.
© City Index 2024