Crude oil rebounds
Crude supply data from the American Petroleum Institute on Wednesday had raised expectations that we would see the first inventory build in the US for six weeks. That was indeed the case, as it turned out. According to the US Department of Energy, the crude inventory build was 4.9 million barrels last week, which was easily more than that reported by the API and also above expectations. Consequently, WTI dropped to a low of $49.40 as the algos and human traders reacted to the headline number. However, traders were quick to close out their bearish positions after they read the details of the report and realised that stocks of Cushing crude, gasoline and distillates all fell quite sharply while total production also declined a tad. So, the oil report wasn’t as bearish as the headline crude build had suggested. As a result, oil prices were quick to jump back into the positive territory and WTI was trading back at a good $50.50 a barrel at the time of this writing. With the OPEC still widely expected to cut its production, oil prices could further extend their gains as we approach year-end. As before, I think a price range of $45 to $65 is where WTI is likely to spend most of its time.
Today’s bounce in oil prices also makes technical sense. In upward trends, markets tend to rebound on the third day of a counter-trend move. On the first day of the down move, the so-called “smart money” starts to take profit on long positions. This continues on the second day when the semi-smart money also reduces its exposure. On the third day, the not-so-smart market participants think that the uptrend is over and so they too start selling. Sometimes they sell right at or near the lows and this is when the smart money reloads the bullish positions. If this thesis is true, we ‘should’ see oil prices continue their advance on Friday and potentially beyond.
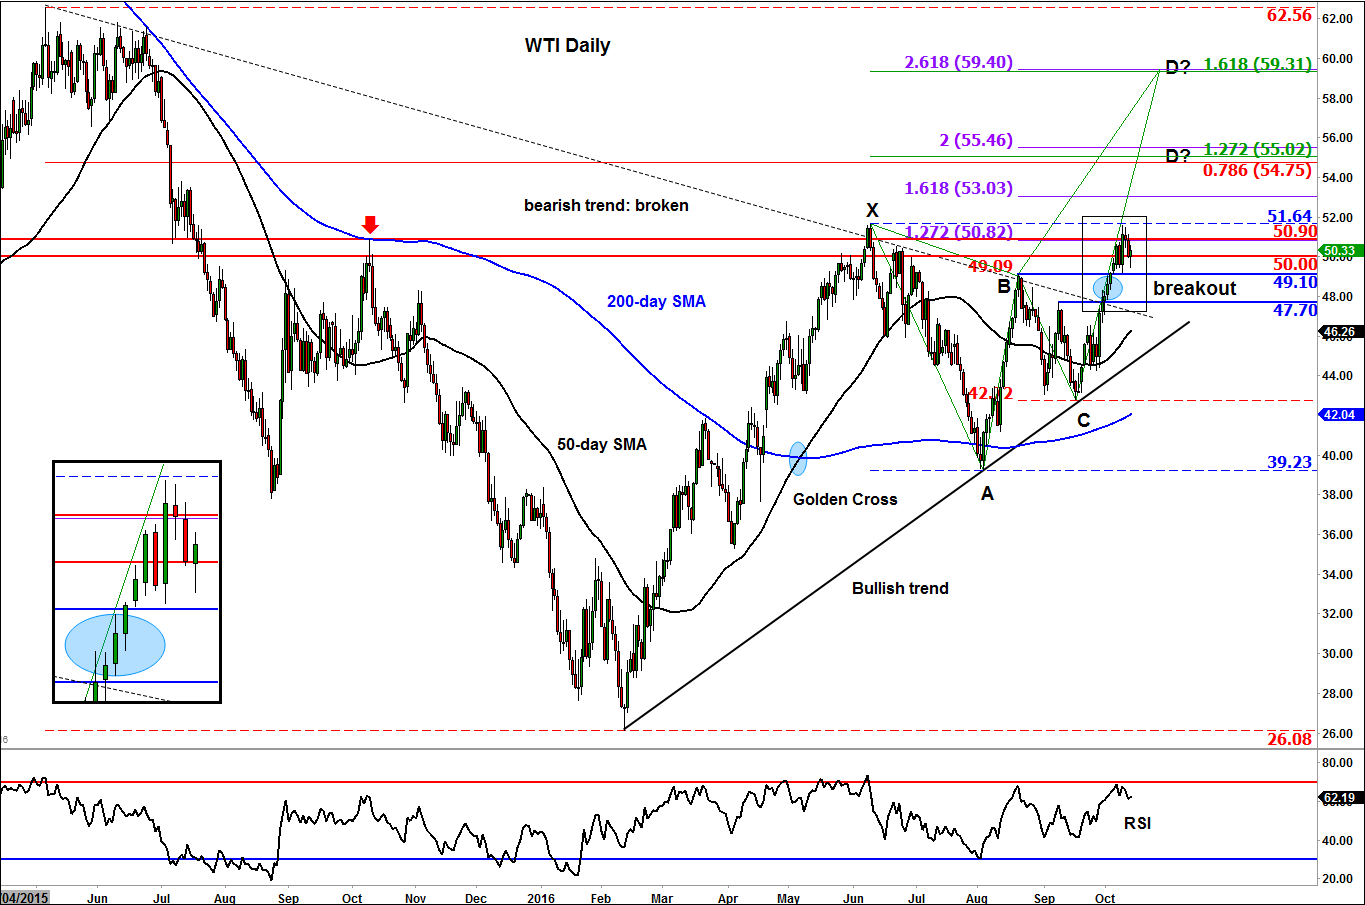
Indeed, the recent breakout above key short-term resistance levels means the path of least resistance is still to the upside for oil. This will only change in our view if WTI were to break back below support levels at $49.10 or ideally (“ideally” for the bears that is) $47.70. The bulls will now need to clear resistance at $50.90 and then top of the recent range at $51.65. If and when successful, the rally could potentially go much further as new momentum-based traders join in. A couple of very interesting levels that I would be watching, should we get there, are around $55 and then at $59.30/40. As can be seen on the chart, these are where several Fibonacci levels converge, which make them ideal profit-target areas for market participants who like myself use the Fibonacci tool in their analysis and trading. So there is the potential for WTI to climb to those levels and possibly find resistance there amid profit-taking.
StoneX Financial Ltd (trading as “City Index”) is an execution-only service provider. This material, whether or not it states any opinions, is for general information purposes only and it does not take into account your personal circumstances or objectives. This material has been prepared using the thoughts and opinions of the author and these may change. However, City Index does not plan to provide further updates to any material once published and it is not under any obligation to keep this material up to date. This material is short term in nature and may only relate to facts and circumstances existing at a specific time or day. Nothing in this material is (or should be considered to be) financial, investment, legal, tax or other advice and no reliance should be placed on it.
No opinion given in this material constitutes a recommendation by City Index or the author that any particular investment, security, transaction or investment strategy is suitable for any specific person. The material has not been prepared in accordance with legal requirements designed to promote the independence of investment research. Although City Index is not specifically prevented from dealing before providing this material, City Index does not seek to take advantage of the material prior to its dissemination. This material is not intended for distribution to, or use by, any person in any country or jurisdiction where such distribution or use would be contrary to local law or regulation.
For further details see our full non-independent research disclaimer and quarterly summary.
CFDs are complex instruments and come with a high risk of losing money rapidly due to leverage. 69% of retail investor accounts lose money when trading CFDs with this provider. You should consider whether you understand how CFDs work and whether you can afford to take the high risk of losing your money. CFD and Forex Trading are leveraged products and your capital is at risk. They may not be suitable for everyone. Please ensure you fully understand the risks involved by reading our full risk warning.
City Index is a trading name of StoneX Financial Ltd. Head and Registered Office: 1st Floor, Moor House, 120 London Wall, London, EC2Y 5ET. StoneX Financial Ltd is a company registered in England and Wales, number: 05616586. Authorised and regulated by the Financial Conduct Authority. FCA Register Number: 446717.
City Index is a trademark of StoneX Financial Ltd.
The information on this website is not targeted at the general public of any particular country. It is not intended for distribution to residents in any country where such distribution or use would contravene any local law or regulatory requirement.
© City Index 2024