Crude oil rally s gravestone carved
Crude oil prices fell sharply at the end of last week and have extended their losses as the new week begins. At the time of this writing, Brent oil was back at $50 and WTI was hovering around $48.50, a good 6% off its high on Thursday.
Oil prices have fallen because of various reasons, chief among them being a rallying US dollar and a sharp rise in risk aversion. This is evidenced, for example, by the slumping global stock markets, and rallying safe-haven government bond prices, yen and gold. Investors are spooked about the prospects of a UK exit from the EU, the economic impact of a potential US rate rise in the summer, and renewed demand concerns out of China.
In addition, there signs that US oil producers are beginning to drill for crude again now that prices have recovered to around $50 a barrel. According to Baker Hughes, the oil rig count rose by an additional three rigs last week after increasing by nine the week before.
This is something that we have been repeatedly warned about in recent weeks as oil prices surged higher. Although the oil rally could still go north of $60 and reach even $70, this serves as a reminder that the global supply glut is unlikely to be eradicated completely any time soon, even if the market appears to be a lot tighter than it was at the start of the year thanks to unscheduled global production outages and a decline in US oil production.
Technical outlook: WTI
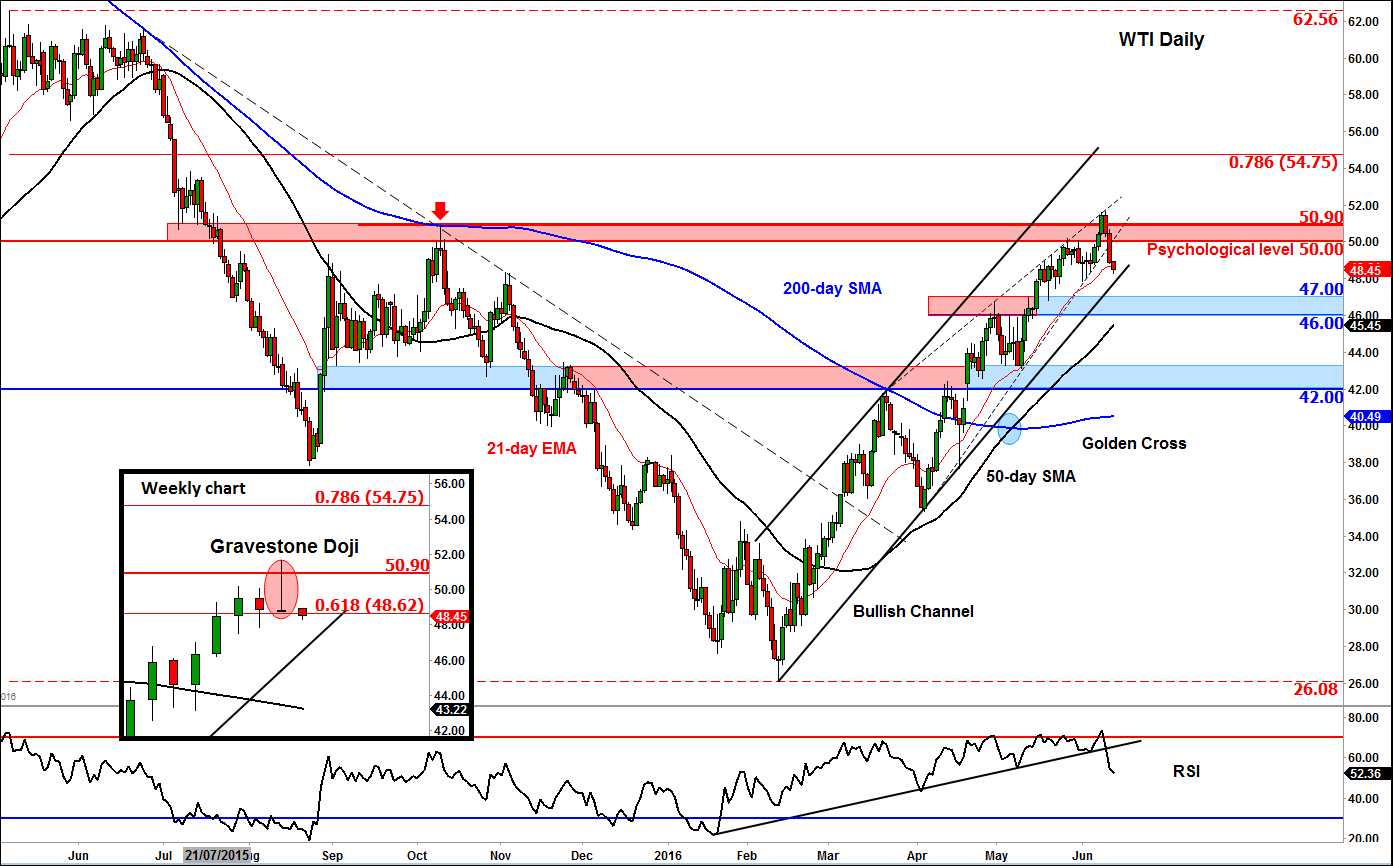
Following last week’s sell-off, the weekly chart of WTI (in the inset) is left with a “Gravestone Doji” candlestick pattern. This is formed when the opening and closing prices are roughly the same and at the low of the candle. There is also a long upper shadow, or a wick, which suggests that the previous buying pressure was countered by selling. In short, this pattern usually, but not always, suggests that the direction of the trend may be nearing a turning point. But it is not always as simple as that, and in this case, there is also a couple of other things to take into account. For one, the RSI on daily time frame had been severely overbought, so a near-term pullback was almost inventible. The momentum indicator may need to unwind further either through time or price action before the buyers step back in. For another, the prior swing high was at $50.90, where lots of bullish traders were probably looking to book profit around anyway.
It looks like the false break above this $50.90 level may have trapped some late joiners, some of whom have undoubtedly been forced to exit their long positions by now. If the trend is still bullish then we should see some re-load buying activity once WTI nears or tests some key support levels. So we could see some sellers being trapped here now that WTI’s weekly chart has formed a bearish-looking pattern inside what still is a bullish trend. So the sellers need to be wary of that possibility especially after a sharp three-day countertrend move and as the short momentum indicators are, all of a sudden, at “oversold” levels. In fact, the support tend of bullish channel is now not too far off at around the $47.60-$48.00 area. Here, we may see buying activity, not least because of profit-taking from the sellers. However if the bullish channel breaks down then we may see an even deeper pullback before oil makes its next move. In any case, the bulls now need a move back above the prior swing high of $50.90.
StoneX Financial Ltd (trading as “City Index”) is an execution-only service provider. This material, whether or not it states any opinions, is for general information purposes only and it does not take into account your personal circumstances or objectives. This material has been prepared using the thoughts and opinions of the author and these may change. However, City Index does not plan to provide further updates to any material once published and it is not under any obligation to keep this material up to date. This material is short term in nature and may only relate to facts and circumstances existing at a specific time or day. Nothing in this material is (or should be considered to be) financial, investment, legal, tax or other advice and no reliance should be placed on it.
No opinion given in this material constitutes a recommendation by City Index or the author that any particular investment, security, transaction or investment strategy is suitable for any specific person. The material has not been prepared in accordance with legal requirements designed to promote the independence of investment research. Although City Index is not specifically prevented from dealing before providing this material, City Index does not seek to take advantage of the material prior to its dissemination. This material is not intended for distribution to, or use by, any person in any country or jurisdiction where such distribution or use would be contrary to local law or regulation.
For further details see our full non-independent research disclaimer and quarterly summary.
CFDs are complex instruments and come with a high risk of losing money rapidly due to leverage. 69% of retail investor accounts lose money when trading CFDs with this provider. You should consider whether you understand how CFDs work and whether you can afford to take the high risk of losing your money. CFD and Forex Trading are leveraged products and your capital is at risk. They may not be suitable for everyone. Please ensure you fully understand the risks involved by reading our full risk warning.
City Index is a trading name of StoneX Financial Ltd. Head and Registered Office: 1st Floor, Moor House, 120 London Wall, London, EC2Y 5ET. StoneX Financial Ltd is a company registered in England and Wales, number: 05616586. Authorised and regulated by the Financial Conduct Authority. FCA Register Number: 446717.
City Index is a trademark of StoneX Financial Ltd.
The information on this website is not targeted at the general public of any particular country. It is not intended for distribution to residents in any country where such distribution or use would contravene any local law or regulatory requirement.
© City Index 2024