Crude oil rallies in volatile session
While the FX and stock markets have endured a rather dull day of trading, for speculators in the commodities market – oil in particular – things have been slightly different. Today has seen crude oil prices initially fall, then rally, then fall back and then bounce again. Yes, it has been a volatile day. In fact, the volatility has continued from Friday when crude prices started the day brightly before surrendering the entire gains in the space of a few minutes, despite news of another drop in the Baker Hughes rig count data – this time by 10 to 564. Traders were eager to book quick profit ahead of the weekend. Overnight, both oil contracts started the new trading week on the back foot and by the European morning session they were trading between 2-3 per cent worse off. Then prices turned sharply higher, triggered by news Saudi Arabia is willing to cooperate with non-OPEC crude producing countries and is ready to “do what it takes” to help stabilize the oil market. Traders interpreted the Saudi oil minister Al-Naimi’s comments as an admission that his previous strategy of flooding the market to drive out shale producers has failed. With the OPEC’s meeting now just a couple of weeks away, there is a risk that we may now see a sharp rebound in oil prices over the coming days as the shorts rush for the exits and prices recover from severely oversold levels. But jawboning will only have limited impact – we need to see some actual supply reduction for oil prices to recover in a meaningful way. Nevertheless, Al-Naimi’s apparent change of tone could turn out to be a significant development that should be ignored at your peril.
Technical outlook
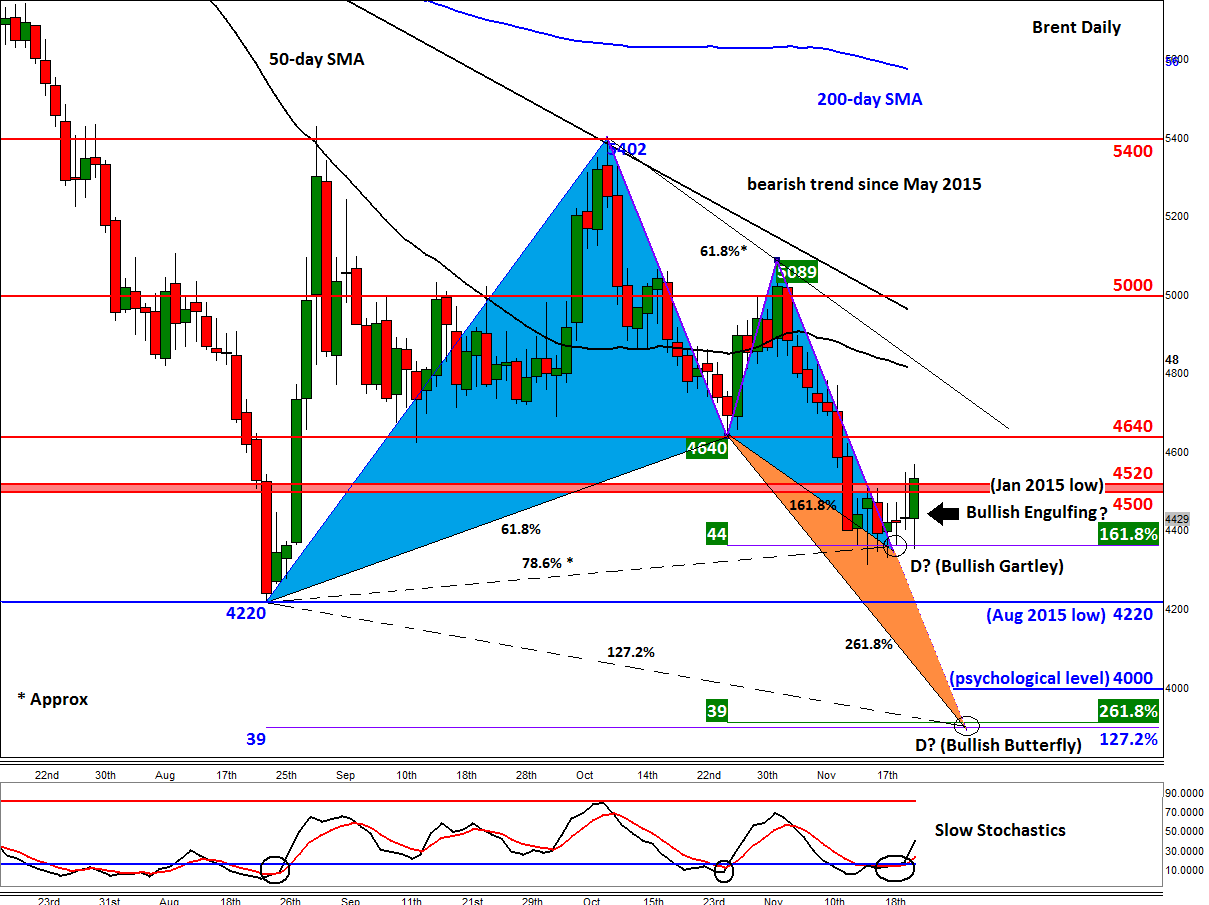
Over the past several days, Brent crude has consistently been finding decent support around the $43.50 – $44.00 price range following a big drop recently. As can be seen on the chart, a couple of Fibonacci levels converge with the point D of an AB=CD move here. So, we have a Bullish Gartley pattern here, which can sometimes pinpoint major lows and highs in the markets. So far this pattern is holding and today we have a bullish engulfing candle in the making. Brent is also holding its own above resistance around the $45.00-$45.20 region. If this breaks on a closing basis then we may see a more aggressive rally at least towards the bearish trends and the 50-day moving average, around $48.00 next. Supporting the bullish case here is the fact that the Slow Stochastics indicator has created a bullish crossover and is rising from the oversold threshold. The bearish momentum is fast weakening, in other words. But if Brent fails once again at these levels and eventually falls below the abovementioned Bullish Gartley support, then the next logical target for the bears would be the August low around $42.20. Thereafter a more significant Bullish Butterfly pattern comes in around $39. This formation is the same as the Gartley in that it is constructed by Fibonacci levels, but the point D comes in below the 100% retracement of XA, in this case at the 127.2% extension level. The CD leg is also extended – in this case, by 161.8 per cent times AB. The area around $39 is also where the 261.8% of the BC move resides, thus making it an exhaustion point. But will oil even get to $39 and even if it does, will it necessarily form a major base? Indeed, we could simply see a short-term bounce, before the trend resumes and oil prices fall further. So treat all these Gartley/Butterfly and indeed any other technical patterns with caution, especially when going against the underlying trend.
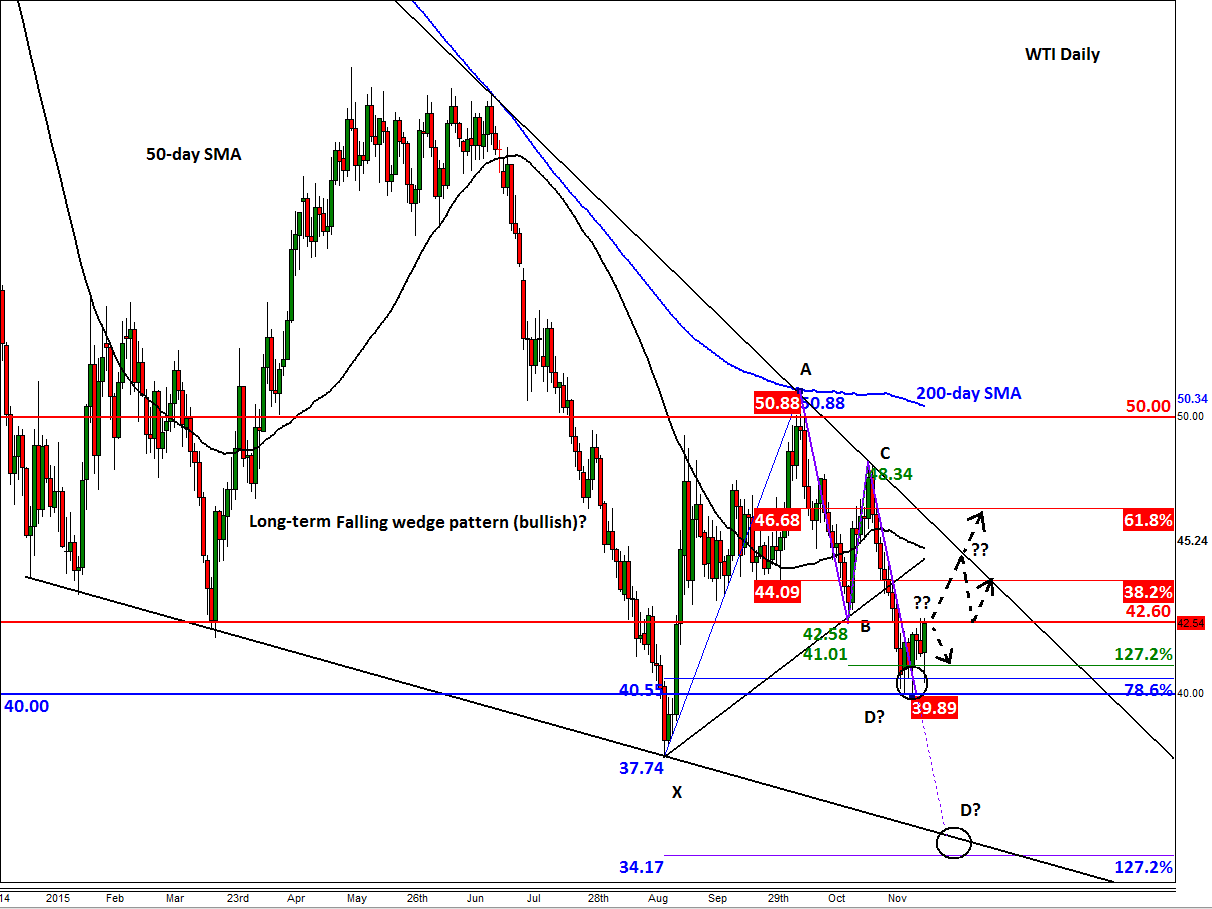
Similarly, the WTI contact is showing a Bullish Gartley pattern of its own on the daily chart. The US oil contact is currently testing support-turned-resistance at $42.60 for a second straight trading day. A break above here would be a bullish outcome and we could see oil head towards the bear trend of the apparent long-term falling wedge pattern around $45 next. However if the rally falters here once more then there is a risk for WTI to fall all the way towards the support trend of this formation around $34-$35 in the coming days. As things stand, the bulls appear to be regaining some control, however.
StoneX Financial Ltd (trading as “City Index”) is an execution-only service provider. This material, whether or not it states any opinions, is for general information purposes only and it does not take into account your personal circumstances or objectives. This material has been prepared using the thoughts and opinions of the author and these may change. However, City Index does not plan to provide further updates to any material once published and it is not under any obligation to keep this material up to date. This material is short term in nature and may only relate to facts and circumstances existing at a specific time or day. Nothing in this material is (or should be considered to be) financial, investment, legal, tax or other advice and no reliance should be placed on it.
No opinion given in this material constitutes a recommendation by City Index or the author that any particular investment, security, transaction or investment strategy is suitable for any specific person. The material has not been prepared in accordance with legal requirements designed to promote the independence of investment research. Although City Index is not specifically prevented from dealing before providing this material, City Index does not seek to take advantage of the material prior to its dissemination. This material is not intended for distribution to, or use by, any person in any country or jurisdiction where such distribution or use would be contrary to local law or regulation.
For further details see our full non-independent research disclaimer and quarterly summary.
CFDs are complex instruments and come with a high risk of losing money rapidly due to leverage. 69% of retail investor accounts lose money when trading CFDs with this provider. You should consider whether you understand how CFDs work and whether you can afford to take the high risk of losing your money. CFD and Forex Trading are leveraged products and your capital is at risk. They may not be suitable for everyone. Please ensure you fully understand the risks involved by reading our full risk warning.
City Index is a trading name of StoneX Financial Ltd. Head and Registered Office: 1st Floor, Moor House, 120 London Wall, London, EC2Y 5ET. StoneX Financial Ltd is a company registered in England and Wales, number: 05616586. Authorised and regulated by the Financial Conduct Authority. FCA Register Number: 446717.
City Index is a trademark of StoneX Financial Ltd.
The information on this website is not targeted at the general public of any particular country. It is not intended for distribution to residents in any country where such distribution or use would contravene any local law or regulatory requirement.
© City Index 2024