Crude oil outlook remains murky
The volatility in crude oil prices remains high, underscoring the uncertainty about the outlook for the black stuff. On the one hand, the latest macroeconomic data continues to point to weaker economic growth, most notably in China, implying slower demand growth for crude. On the other hand however, there are tentative signs that suggest US shale oil output is finally responding to the excessive OPEC supplies that have been flooding the market. The US Energy Information Administration (EIA) recently predicted that US oil output in 2015 has grown at a slower pace than previously thought and that 2016 production is expected to fall by about 400,000 barrels per day to 8.96 million bpd. This view is first and foremost supported by the renewed falls in the rig counts as reported weekly by Baker Hughes. What’s more, US crude oil inventories have now fallen for the second straight week, although admittedly the latest 1.9 million drawdown in not as spectacular as had been reported by the API last night. Nevertheless it is a bit unusual for stockpiles to fall at this time of the year given that the US driving season has now ended.
Immediately after the release of the EIA’s oil report, traders were quick to cover their bullish positions that had been opened earlier in the week. As mentioned, not only did inventories fall far less than hoped for but the report also showed that crude production rose marginally too last week, which has raised question marks over the somewhat premature hopes that production is going to start declining almost immediately. Traders are thus realising that the supply glut is here to stay for now and that the pace of the potential falls in supply could be very slow indeed. This in fact is why oil prices have struggled to push noticeably higher after both contracts created what looked like clear reversal signals towards the end of last month.
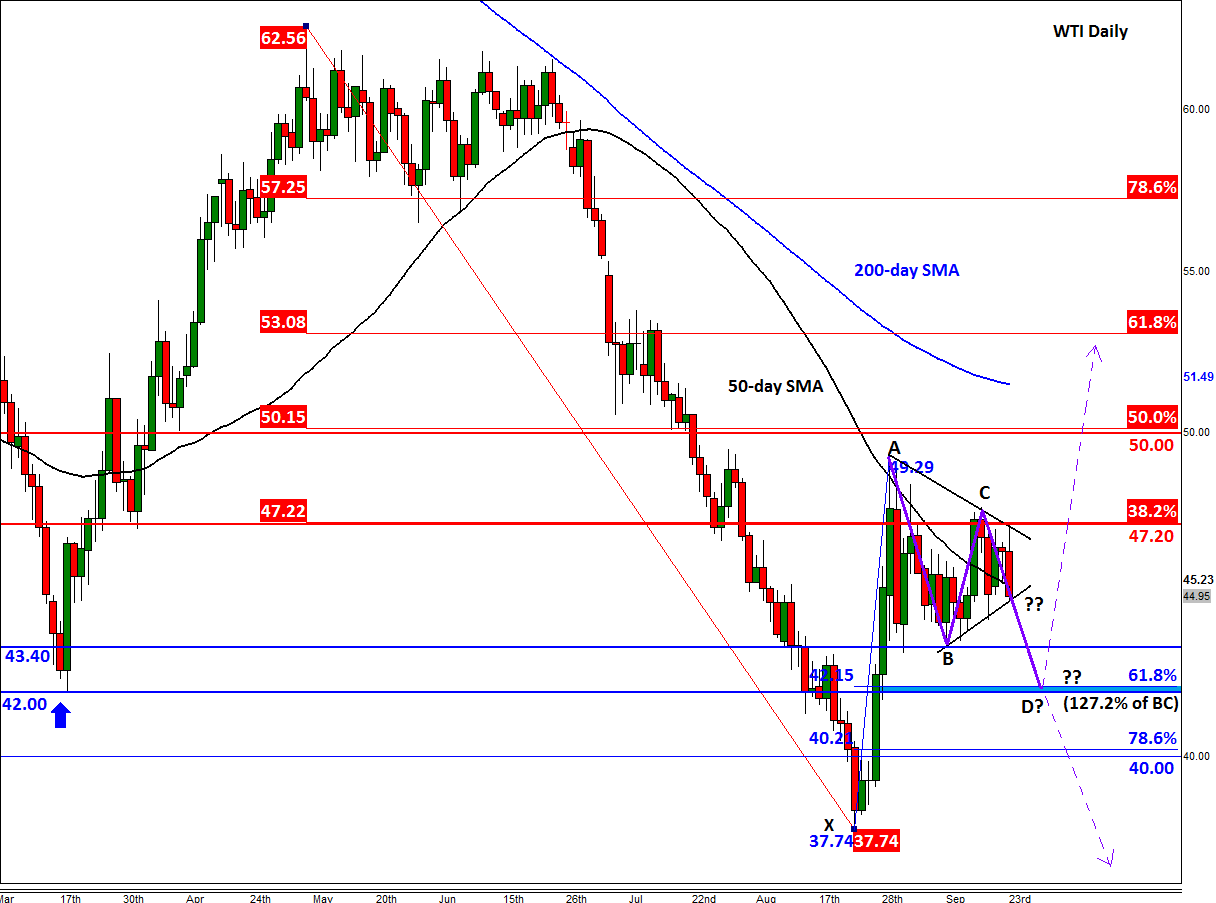
If the rally that some people – myself included – had expected to see, fails to materialise in the coming days then the disappointment alone could be the trigger behind another round of selling. WTI is actually on the verge of a sharp move as it consolidates inside converging trend lines (see the chart, below). At the time of this writing crude was testing the support trend at just below the $55 handle. A closing break below here could lead to further follow-up technical selling towards at least $43.40 which is the next support level to watch. Below this level is the pivotal $42 handle. As well as being the March low, this is where we also have a 61.8% Fibonacci retracement and a 127.2% extension level converging (i.e. of the XA and BC swings, respectively). What happens there, assuming price will get there in the first place, could determine the direction for the next several days or weeks even. A sharp rebound at or around $42 would strongly suggest that US oil may have formed a base, which could then give the would-be buyers the confidence they need in order to make a return. However if $42 breaks on a closing basis then the next stop could well be the August low of $37.75 or even lower.
StoneX Financial Ltd (trading as “City Index”) is an execution-only service provider. This material, whether or not it states any opinions, is for general information purposes only and it does not take into account your personal circumstances or objectives. This material has been prepared using the thoughts and opinions of the author and these may change. However, City Index does not plan to provide further updates to any material once published and it is not under any obligation to keep this material up to date. This material is short term in nature and may only relate to facts and circumstances existing at a specific time or day. Nothing in this material is (or should be considered to be) financial, investment, legal, tax or other advice and no reliance should be placed on it.
No opinion given in this material constitutes a recommendation by City Index or the author that any particular investment, security, transaction or investment strategy is suitable for any specific person. The material has not been prepared in accordance with legal requirements designed to promote the independence of investment research. Although City Index is not specifically prevented from dealing before providing this material, City Index does not seek to take advantage of the material prior to its dissemination. This material is not intended for distribution to, or use by, any person in any country or jurisdiction where such distribution or use would be contrary to local law or regulation.
For further details see our full non-independent research disclaimer and quarterly summary.
CFDs are complex instruments and come with a high risk of losing money rapidly due to leverage. 69% of retail investor accounts lose money when trading CFDs with this provider. You should consider whether you understand how CFDs work and whether you can afford to take the high risk of losing your money. CFD and Forex Trading are leveraged products and your capital is at risk. They may not be suitable for everyone. Please ensure you fully understand the risks involved by reading our full risk warning.
City Index is a trading name of StoneX Financial Ltd. Head and Registered Office: 1st Floor, Moor House, 120 London Wall, London, EC2Y 5ET. StoneX Financial Ltd is a company registered in England and Wales, number: 05616586. Authorised and regulated by the Financial Conduct Authority. FCA Register Number: 446717.
City Index is a trademark of StoneX Financial Ltd.
The information on this website is not targeted at the general public of any particular country. It is not intended for distribution to residents in any country where such distribution or use would contravene any local law or regulatory requirement.
© City Index 2024