Crude oil on the verge of a big breakout
Both crude oil contracts are up for the third consecutive day, with Brent currently trading above the psychologically-important and key resistance level of $50 and WTI above $47 a barrel. Oil prices have been supported by a number of factors lately, including the unwinding of bearish positions, a slightly weaker US dollar, the positive vibes arising from the rebounding stock markets and Russia’s military actions in Syria which has increased supply-side risks in the Middle East region. But above all, it is expectations that US shale oil output is going to start shrinking soon, making the crude market more balanced. At the moment, the market is still pretty much imbalanced due to the relentless increases in supplies, first arising from shale producers in the US and elsewhere and now from the OPEC. But prices have now been depressed for a long-enough period of time to cause uncomfortable pain for some small and inefficient oil companies, most notably in the US. Here, we have seen renewed falls in the active rig counts, with the number declining by an additional 26 rigs last week. At ‘just’ 614, drilling activity is now at its lowest level since August 2010, which points to a potentially sharp drop in US oil production. Oil prices could therefore start rising from these depressed levels over the coming weeks and months as traders adjust their expectations about the future supply and demand equilibrium levels. However, it is important to remember that when prices rise by a noticeable margin and US oil companies start making good profit once more, it will be easy for them to resume drilling and expand production as after all the infrastructure is already there. This will likely cap the gains for both contracts. So, while oil prices could easily extend their gains in the short term, it is questionable whether the potential gains could be maintained in the slightly longer term point of view.
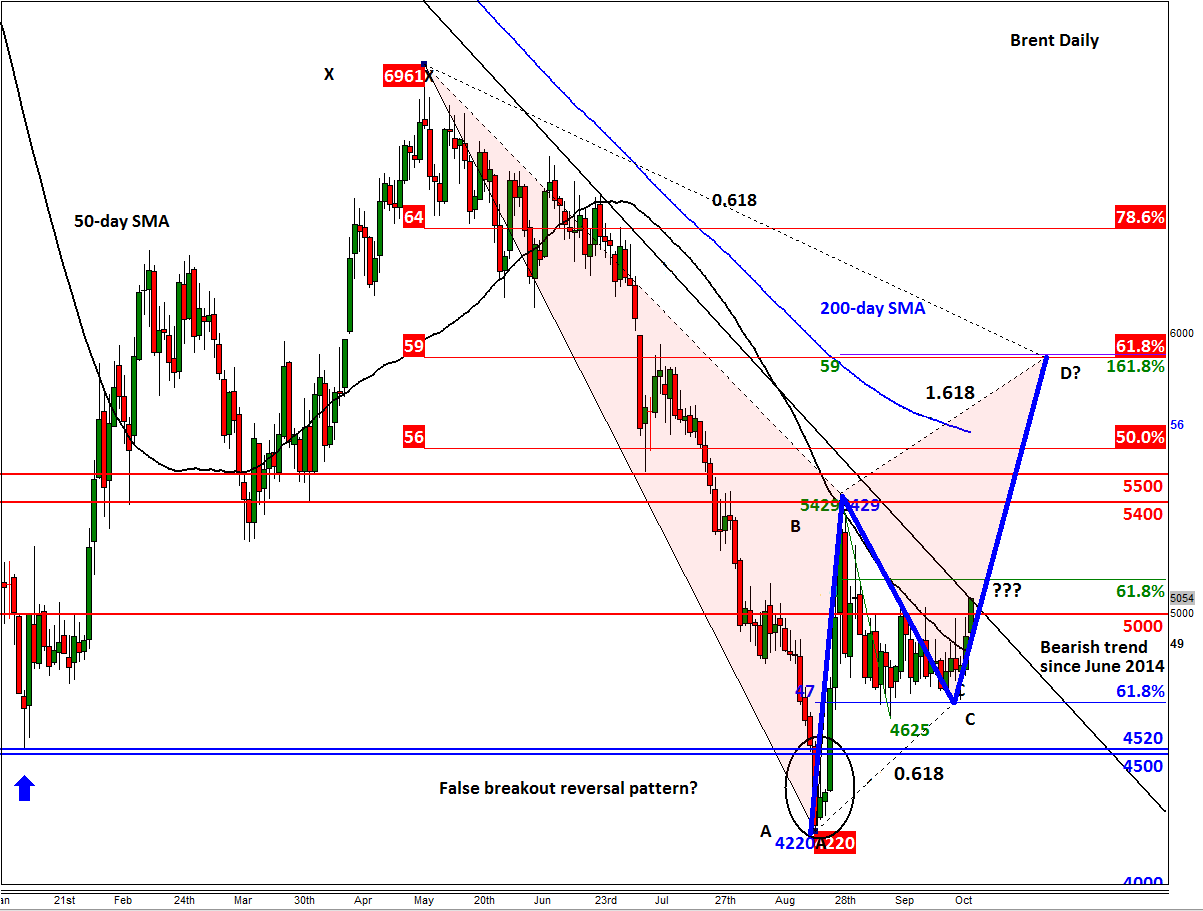
Nevertheless, from a technical point of view, both contracts are testing important levels and are potentially on the verge of a big breakout. Brent is currently testing a bearish trend line that goes back all the way to the summer of last year (i.e. that is when oil prices first started to decline). This trend line comes in around $50.50. A decisive break above here could see Brent easily rally to $54/55, the previous support-turned-resistance area, before making its next move. But as the chart shows, below, there is also the possibility that oil may have already put in a major bottom when it failed to hold below the prior 2015 low of around $45 in the summer. We saw a big rally after that false breakdown at the end of August before prices went into consolidation for the best part of September.
Following that sharp rally and the corresponding consolation phase over the past month or so, we have been continually looking for bullish signs around the 61.8% Fibonacci level at $47 or the previous support around $45. As it has turned out, the 61.8% Fibonacci level has in fact turned into a major support level for Brent. If the London-based oil contract now breaks decisively above the bearish trend line, which appears very much likely, then it may be able to rally all the way to the projected Bearish Gartley entry point at $59. This is where the 61.8% Fibonacci retracement level of the last significant downswing from May meets the 161.8% extension of the downward move from the high that was achieved at the end of August. However, if the bearish trend holds and price ends back below the $50 handle then we could see a sharp unwinding of the bullish positions later this week and thus a quick retreat.
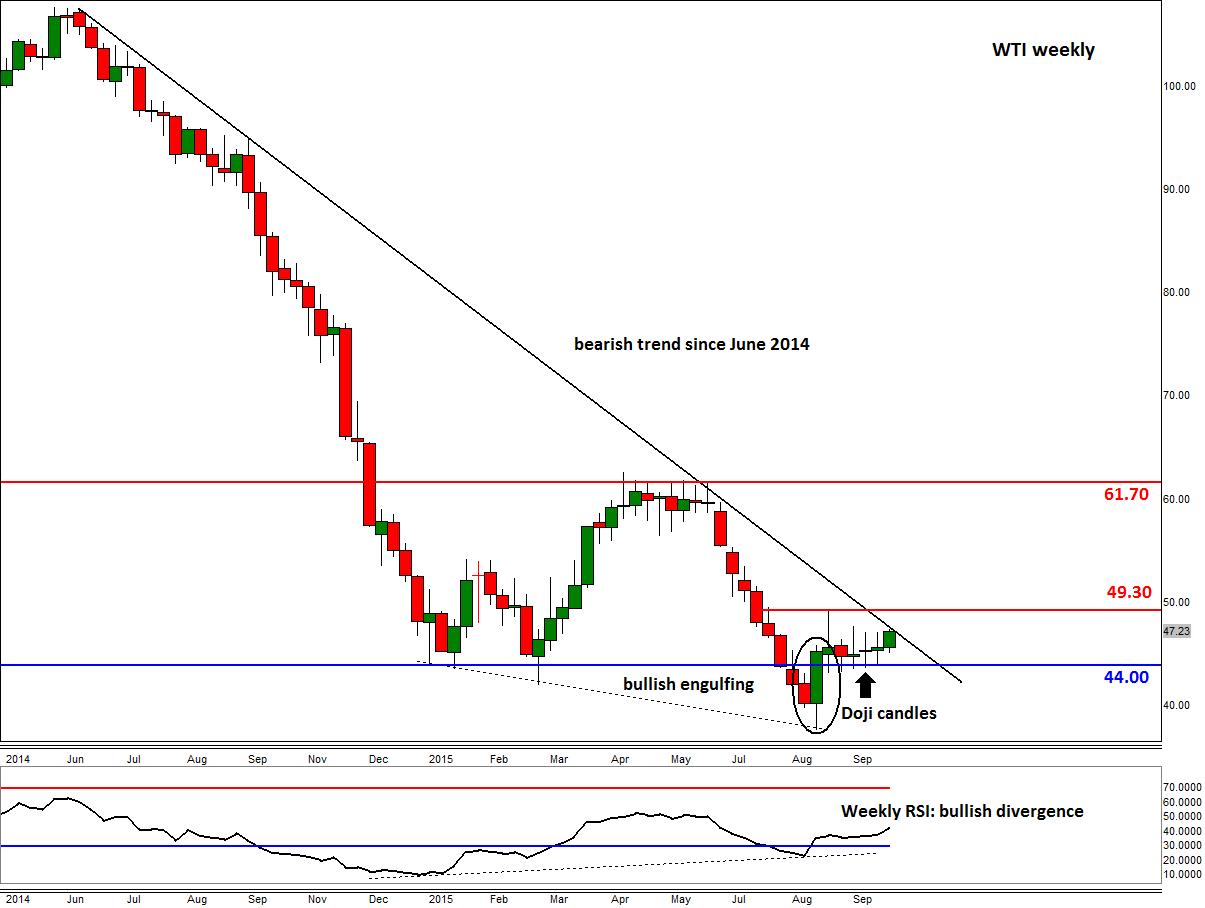
Likewise, WTI is testing its own bearish trend line around $47.30 and is therefore on the verge of a big break out should the bulls win the battle here. This week’s rally was preceded with a period of indecisive price action as highlighted by the three doji candles on the weekly chart. Those had been formed after the creation of a large bullish engulfing candle we saw at the end of August when the sellers were unable to hold their ground below the prior 2015 lows of $42-$44 range. In other words, WTI is displaying pretty much the same technical setup as Brent.
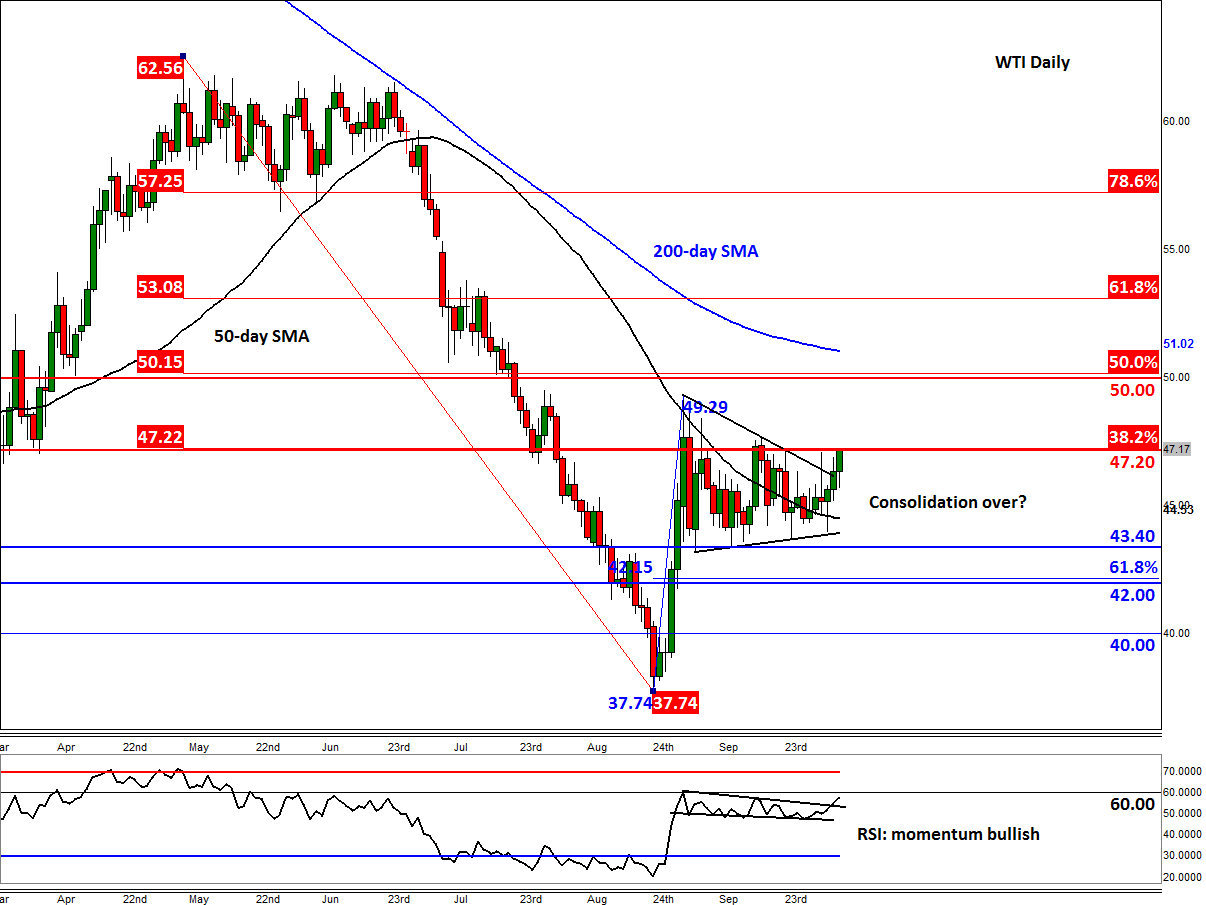
The daily chart of WTI meanwhile shows that US oil has potentially ended its consolidation phase and is ready to move higher. Correspondingly, the momentum indicator, RSI, has also broken out of a tight range, though it is still holding below the key 60 level. If the RSI breaks above 60 at or around the same time as WTI potentially takes out its bearish trend line, then this would confirm the breakout and would thus paint a very bullish outlook.
While the bulls and bears battle it out, conservative traders are probably just waiting on the side-lines for crude to make up its mind before coming back into the game. As things stand, a weekly close below $44 for WTI would be a bearish outcome while a break above the trend line and ideally the August high of $49.30 would be a bullish scenario. Once these would-be sellers or, perhaps more likely, buyers show their presence then oil prices could sharply extend their moves in the direction of the breakout.
StoneX Financial Ltd (trading as “City Index”) is an execution-only service provider. This material, whether or not it states any opinions, is for general information purposes only and it does not take into account your personal circumstances or objectives. This material has been prepared using the thoughts and opinions of the author and these may change. However, City Index does not plan to provide further updates to any material once published and it is not under any obligation to keep this material up to date. This material is short term in nature and may only relate to facts and circumstances existing at a specific time or day. Nothing in this material is (or should be considered to be) financial, investment, legal, tax or other advice and no reliance should be placed on it.
No opinion given in this material constitutes a recommendation by City Index or the author that any particular investment, security, transaction or investment strategy is suitable for any specific person. The material has not been prepared in accordance with legal requirements designed to promote the independence of investment research. Although City Index is not specifically prevented from dealing before providing this material, City Index does not seek to take advantage of the material prior to its dissemination. This material is not intended for distribution to, or use by, any person in any country or jurisdiction where such distribution or use would be contrary to local law or regulation.
For further details see our full non-independent research disclaimer and quarterly summary.
CFDs are complex instruments and come with a high risk of losing money rapidly due to leverage. 69% of retail investor accounts lose money when trading CFDs with this provider. You should consider whether you understand how CFDs work and whether you can afford to take the high risk of losing your money. CFD and Forex Trading are leveraged products and your capital is at risk. They may not be suitable for everyone. Please ensure you fully understand the risks involved by reading our full risk warning.
City Index is a trading name of StoneX Financial Ltd. Head and Registered Office: 1st Floor, Moor House, 120 London Wall, London, EC2Y 5ET. StoneX Financial Ltd is a company registered in England and Wales, number: 05616586. Authorised and regulated by the Financial Conduct Authority. FCA Register Number: 446717.
City Index is a trademark of StoneX Financial Ltd.
The information on this website is not targeted at the general public of any particular country. It is not intended for distribution to residents in any country where such distribution or use would contravene any local law or regulatory requirement.
© City Index 2024