Crude oil indecisiveness should end soon
Judging by the recent price action, it seems as though oil speculators are almost convinced about an imminent drop in US crude output, which is needed in order for the current supply excess to be reduced in a meaningful way. But increased output from the OPEC and potentially Russia may help to keep the global glut fully replenished, which together with growing concerns about a sharp economic slowdown in China could help to prevent oil prices from rising noticeably. With speculators clearly undecided about which of these arguments carry more weight, oil prices are continuing to alternate between gains and losses. Indeed, after dropping sharply yesterday, both crude contracts have now more than made up those losses.
Oil speculators are looking forward to the release of the latest crude stockpiles data from the American Petroleum Institute (API) and Energy Information Administration (EIA). The API will report its numbers on Tuesday night while the official EIA’s report will be published Wednesday afternoon. Over the past couple of weeks, there have been surprise falls in US stockpiles; surprise because it is unusual at this time of the year for inventories to fall, with the seasonal driving season now over. If we see further sharp drawdowns in crude stocks then that could help support oil prices, while a run of sharp builds now should intensify excessive supply concerns once more. As well as the US crude stocks data, traders will focus this week on the latest Chinese manufacturing PMI numbers on Thursday. If the current trend of weaker economic data continues, oil prices may fall back on demand concerns. The potential impact of US economic data on oil may be felt through the reaction of the dollar, which implies that bad US macro data may actually be good news for buck-denominated commodities like oil and gold, and vice versa.
Technical view: WTI
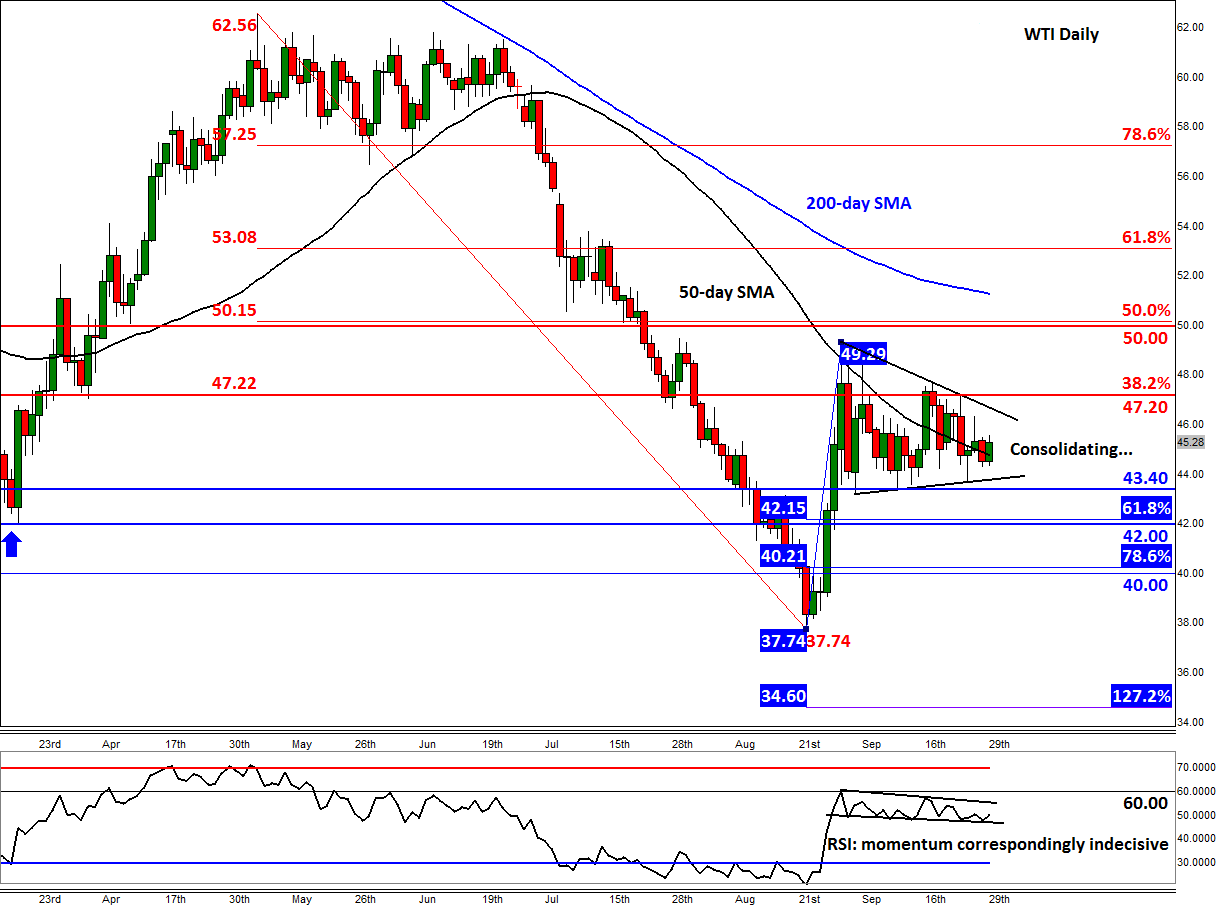
As the daily chart of WTI shows, in figure 1, US oil is effectively in consolidation mode as it oscillates around its 50-day moving average in a pennant-like formation circa $45 a barrel. Correspondingly, the momentum indicator RSI is also stuck in a tight range, holding below the key 60 level. If the RSI breaks above 60 then this could precede a breakout in the underlying prices, while if the indicator moves below 40 then it would confirm renewed bearish momentum.
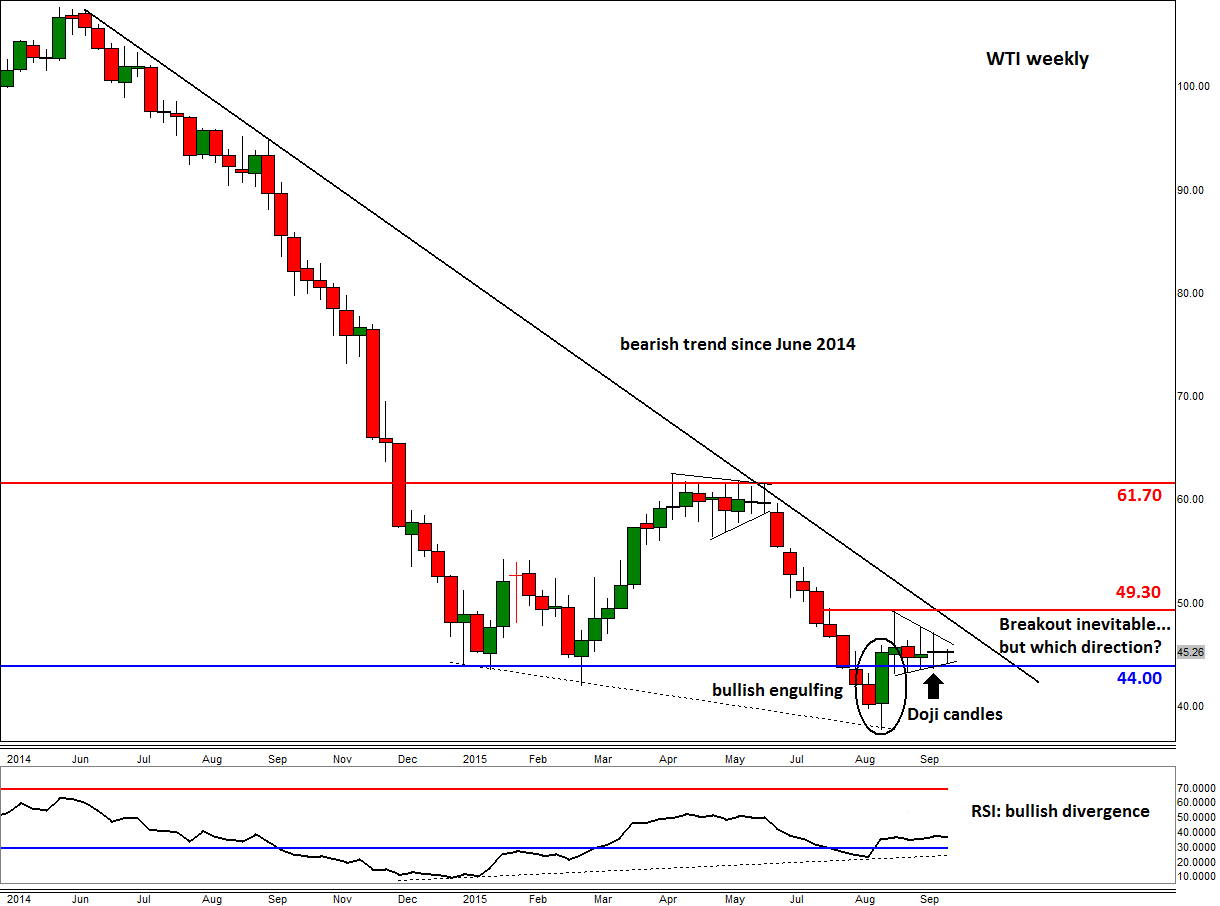
A quick look at the weekly chart of WTI, in figure 2, reveals a similar indecisive price action: doji candles. A doji candlestick is formed when the opening and closing prices are roughly the same with the candles containing wicks on either side. As can be seen, two such candles have already been completed and a third one is potentially being formed this week. These doji candles have been formed after the creation of that large bullish engulfing candle we saw at the end of August when the sellers were unable to hold their ground below the prior 2015 lows of $42-$44 range. Although that may have been a false breakdown and a potential reversal formation, the lack of further follow-through in buying momentum has decreased the probability of such an outcome. But interestingly, the lows of the candles of the past four and a half weeks have been near the upper end of this $42-$44 range, suggesting that the potentially bullish setup may still be in the development phase.
While the bulls and bears battle it out, conservative traders are probably just waiting on the side-lines for WTI to make up its mind before coming back into the game. As things stand, a weekly close below $44 would be a bearish outcome while a break above the trend line and ideally the August high of $49.30 would be a bullish scenario. The good news is that oil prices will soon break out; the bad news is that at this moment it is extremely difficult to say which direction the breakout will be. Either way, the inevitable breakout should open some good trading opportunities in crude.
StoneX Financial Ltd (trading as “City Index”) is an execution-only service provider. This material, whether or not it states any opinions, is for general information purposes only and it does not take into account your personal circumstances or objectives. This material has been prepared using the thoughts and opinions of the author and these may change. However, City Index does not plan to provide further updates to any material once published and it is not under any obligation to keep this material up to date. This material is short term in nature and may only relate to facts and circumstances existing at a specific time or day. Nothing in this material is (or should be considered to be) financial, investment, legal, tax or other advice and no reliance should be placed on it.
No opinion given in this material constitutes a recommendation by City Index or the author that any particular investment, security, transaction or investment strategy is suitable for any specific person. The material has not been prepared in accordance with legal requirements designed to promote the independence of investment research. Although City Index is not specifically prevented from dealing before providing this material, City Index does not seek to take advantage of the material prior to its dissemination. This material is not intended for distribution to, or use by, any person in any country or jurisdiction where such distribution or use would be contrary to local law or regulation.
For further details see our full non-independent research disclaimer and quarterly summary.
CFDs are complex instruments and come with a high risk of losing money rapidly due to leverage. 69% of retail investor accounts lose money when trading CFDs with this provider. You should consider whether you understand how CFDs work and whether you can afford to take the high risk of losing your money. CFD and Forex Trading are leveraged products and your capital is at risk. They may not be suitable for everyone. Please ensure you fully understand the risks involved by reading our full risk warning.
City Index is a trading name of StoneX Financial Ltd. Head and Registered Office: 1st Floor, Moor House, 120 London Wall, London, EC2Y 5ET. StoneX Financial Ltd is a company registered in England and Wales, number: 05616586. Authorised and regulated by the Financial Conduct Authority. FCA Register Number: 446717.
City Index is a trademark of StoneX Financial Ltd.
The information on this website is not targeted at the general public of any particular country. It is not intended for distribution to residents in any country where such distribution or use would contravene any local law or regulatory requirement.
© City Index 2024