Crude oil in consolidation mode ahead of OPEC meeting
Having momentarily surpassed the $50 hurdle, Brent and WTI suffered from profit-taking in the second half of Thursday’s session before extending their losses slightly on Friday morning. Despite the pullback, both oil contracts still looked set to close higher for the third straight week. Oil prices have been boosted by a number of factors lately, including the unscheduled production outages, continued output decreases in the US and strong demand for gasoline at the start of the driving season. According to the Energy Information Administration, oil production in the US fell by an additional 24,000 to 8.767 million barrels per day in the week to May 20 as total crude inventories decreased by a sharper-than-expected 4.23 million barrels on the week. After falling for 17 out of the past 18 weeks, oil production in the US is now at the lowest level since September 2014.
As oil prices continue to rise however, it will become lucrative for US shale oil companies to ramp up production once again, which could put a ceiling on oil prices. First to respond will probably be the rig counts, which failed to decrease last week for the first time since mid-March and only the second time this year. If the counts begin to stabilise or start to climb then this should be a warning sign for the on-going oil price rally. Baker Hughes will be reporting this week’s data later on Friday’s session. Meanwhile hedging by oil companies to lock in a higher sell price for future delivery may also help to halt the oil rally. That being said, it is impossible to say at what price the impact of these bearish factors will start to outweigh the bullish dynamics. But we have now entered the lower band of the $50-$70 range many think will probably be the top for this current cycle.
OPEC meeting in focus
As well as key US data, which could have significant implications for the timing of the next Federal Reserve rate decision and therefore the dollar and in turn buck-denominated commodities, next week’s focus will sharpen on the OPEC meeting which is scheduled for Thursday, June 2. After the Doha meetings failed to find an agreement on freezing production, this regular OPEC meeting is unlikely to yield a different result, not when Iran continues to re-iterate that it has no intension of capping its oil production or exports. And with the recent cabinet re-shuffle in Saudi Arabia, the cartel may well continue the Saudi-led policy of flooding the market to drive weaker US shale producers out of business. The OPEC will no doubt use the recent supply disruptions in Canada, the falling output in the US and the firmer oil prices as reasons not to cut production. After all, Saudi’s strategy has finally began to work, so why change it now? In the likely event the OPEC maintains status quo, oil prices may fall, at least initially anyway, as some people are still expecting the OPEC to “do something.” But as our and most other oil analysts’ base case is for no change, the biggest risk would therefore be if the OPEC did actually agree to cut production. This potential scenario would almost certainly lead to a sharp rally in oil prices.
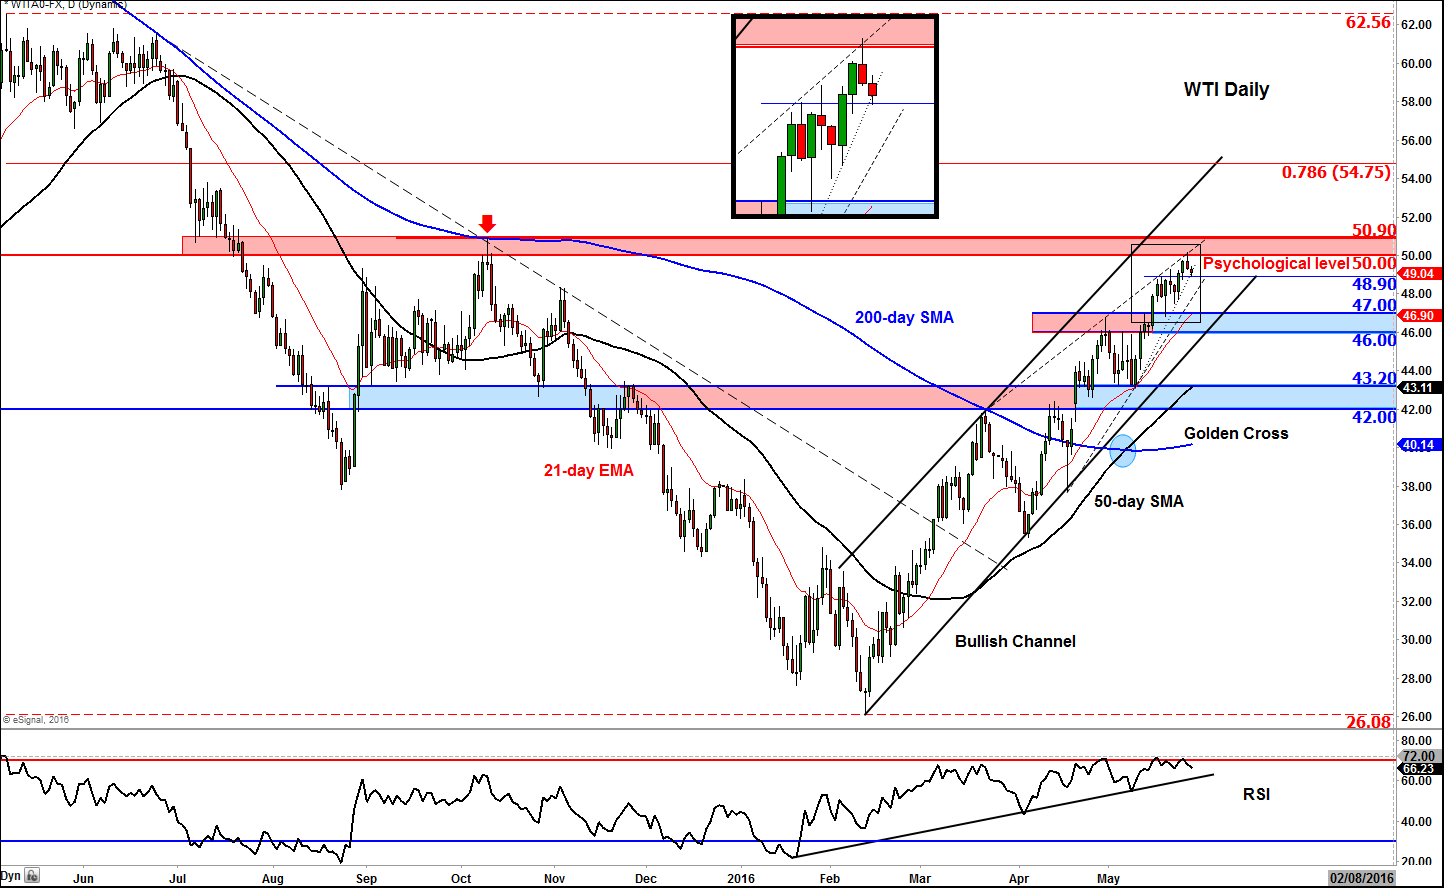
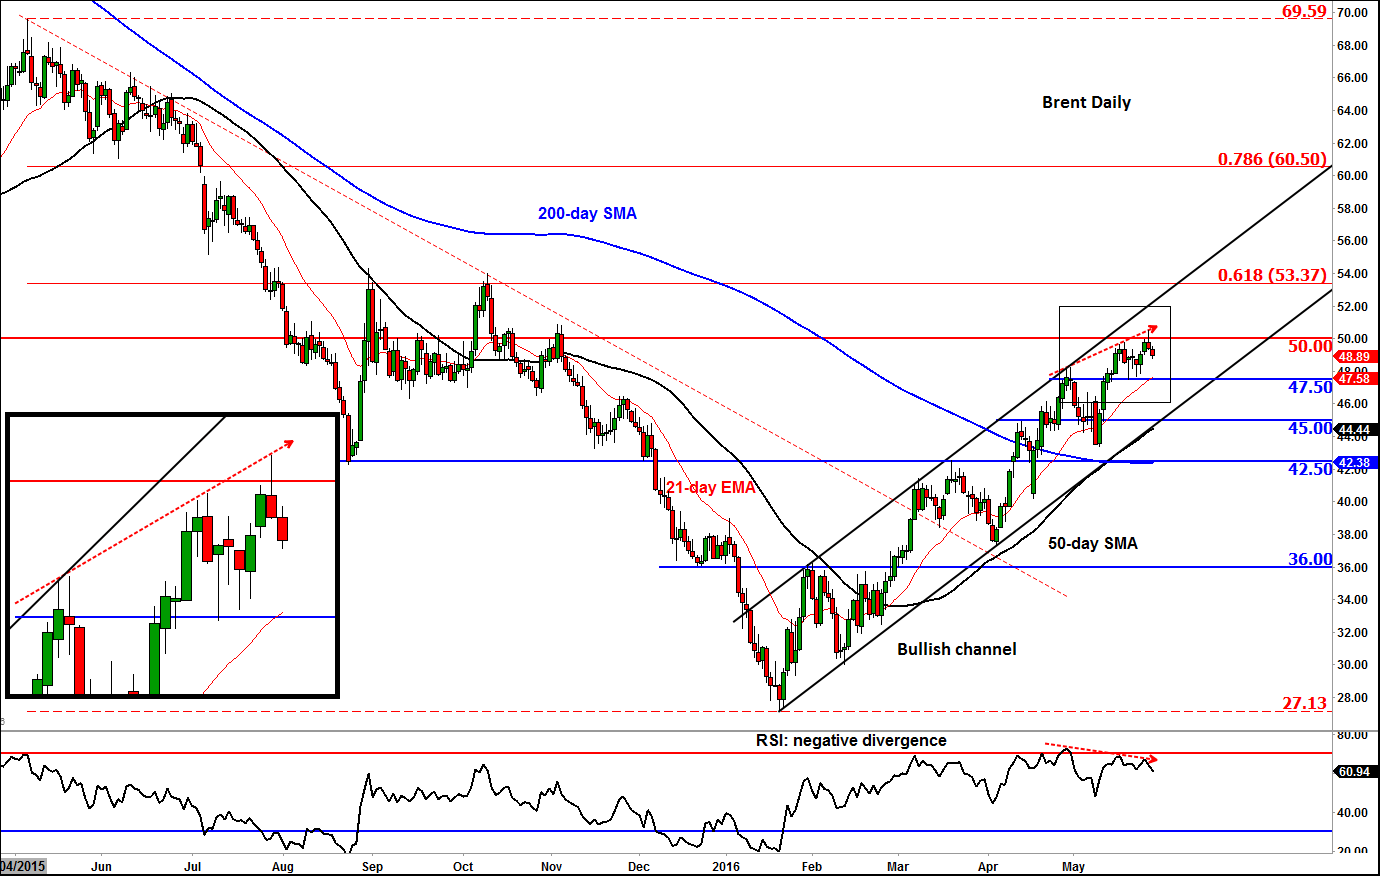
Ahead of next week’s key macro events, oil will prices will likely consolidate around the psychologically-important $50 a barrel, which is not a bad thing as far as the bullish case is concerned. But if oil prices form a base around and rise back above $50 in a bullish manner then this in turn could lead to further momentum buying interest next week. For Brent, the next potential resistance levels above $50 are around $52, the top of its bullish channel, followed by $53.35, the 61.8% Fibonacci retracement against the May 2015 high. WTI meanwhile has already surpassed the corresponding Fibonacci level, so the next retracement level to watch, should we get there, is the 78.6% at $54.75. Ahead of this level, WTI will still need to clear the $50.00-$50.90 resistance range first and the top of its bullish channel second.
Among the support levels to watch for oil, $48.90 is an important level on WTI as it corresponds with a short-term bullish trend line and prior highs. Below here, there is another short term trend line at around $48. The key support is in the $46-$47 range, where the lower trend of the bullish channel meets the previous resistance-turned-support level and the 21-day exponential moving average. The key support for Brent oil is at $47.50. The bears would do very well to push price below this level, given the current strong bullish trend.
Meanwhile the momentum indicator RSI on the daily charts still show negative divergence with price on both oil contracts. This on its own is not a bearish signal but a warning sign for the bulls who are chasing near the highs. If a top were to be found here, prices will chop around for a while, which could be uncomfortable for breakout traders. The strategy of fading the dips is still evidently the trade that works. The bears need to be patient, nimble and very selective as oil prices could easily go a lot higher before making a U-turn.
StoneX Financial Ltd (trading as “City Index”) is an execution-only service provider. This material, whether or not it states any opinions, is for general information purposes only and it does not take into account your personal circumstances or objectives. This material has been prepared using the thoughts and opinions of the author and these may change. However, City Index does not plan to provide further updates to any material once published and it is not under any obligation to keep this material up to date. This material is short term in nature and may only relate to facts and circumstances existing at a specific time or day. Nothing in this material is (or should be considered to be) financial, investment, legal, tax or other advice and no reliance should be placed on it.
No opinion given in this material constitutes a recommendation by City Index or the author that any particular investment, security, transaction or investment strategy is suitable for any specific person. The material has not been prepared in accordance with legal requirements designed to promote the independence of investment research. Although City Index is not specifically prevented from dealing before providing this material, City Index does not seek to take advantage of the material prior to its dissemination. This material is not intended for distribution to, or use by, any person in any country or jurisdiction where such distribution or use would be contrary to local law or regulation.
For further details see our full non-independent research disclaimer and quarterly summary.
CFDs are complex instruments and come with a high risk of losing money rapidly due to leverage. 69% of retail investor accounts lose money when trading CFDs with this provider. You should consider whether you understand how CFDs work and whether you can afford to take the high risk of losing your money. CFD and Forex Trading are leveraged products and your capital is at risk. They may not be suitable for everyone. Please ensure you fully understand the risks involved by reading our full risk warning.
City Index is a trading name of StoneX Financial Ltd. Head and Registered Office: 1st Floor, Moor House, 120 London Wall, London, EC2Y 5ET. StoneX Financial Ltd is a company registered in England and Wales, number: 05616586. Authorised and regulated by the Financial Conduct Authority. FCA Register Number: 446717.
City Index is a trademark of StoneX Financial Ltd.
The information on this website is not targeted at the general public of any particular country. It is not intended for distribution to residents in any country where such distribution or use would contravene any local law or regulatory requirement.
© City Index 2024