Crude oil bounces back
Crude oil has been among the biggest gainers in the first half of the year. One of the main reasons oil bounced back sharply was probably the fact that it had fallen well below its fundamental value due to panic selling earlier in the year. Added to this, the significantly weaker oil price meant it was becoming unprofitable for many US shale producers to pump oil, so they scaled back production. The rally found further support from unscheduled production outages, strong demand and a weaker US dollar. But in recent weeks, the recovery seems to have stalled as the impact of the temporary supply outages waned, Iran continued to increase its output and US production declines slowed down. There have also been concerns about demand due to the impact of UK’s potential exit from the EU as well as the soft patch in US data.
However, after declining for two straight days in the aftermath of the Brexit vote, crude oil bounced back on Tuesday along with equities and the pound. These markets had been severely oversold, so a bounce was overdue anyway, while hopes have also risen about the prospects of a more coordinated central bank response to support the financial markets. News of a potential strike at several Norwegian oil and gas fields which could start on Saturday may also be a factor supporting prices. Meanwhile the US dollar has also eased slightly, providing further relief for the buck-denominated commodity. At the time of this writing, WTI crude oil was trading at $47.40, up a good 2.3 per cent on the day.
But economic and political uncertainty is rife in the UK and Europe and this will likely keep risk sensitive markets under pressure for a while. At the same time, the dollar will probably remain underpinned in the short-term not just due to its perceived safe haven status but indirectly, too, via further potential drops in the EUR/USD and GBP/USD exchange rates. So oil prices may remain pressurised directly, because of demand concerns, and indirectly, due to the fact it is denominated is US dollar. But with oil being mainly a supply-driven market, the renewed fall in the rig counts, if sustained, should help to reduce concerns that US crude oil output is on the rise again. Thus the potential falls could be limited in the near-term outlook.
Oil could consolidate within $50-$70 range in the second half of 2016
In the slightly longer term outlook, US crude supply is likely to fall further this year, although the pace of future declines will slow if prices start to climb north of $50 a barrel as it will become profitable once again for shale companies to ramp up production. Added to this, non-US supply will likely remain high due to production coming back online from regions where there have been unscheduled outages, and as Iran continues to increase its market share following the removal of its sanctions. But I also don’t think the UK’s potential exit from the EU will cause a major economic catastrophe that could materially impact demand for oil. At the same time, the US Federal Reserve is likely to continue pushing back the timing of its next rate hike; this should keep the US dollar under pressure. Together, these factors should help to provide some support for oil prices.
So, overall, what we are looking at is probably a market which will tighten further, with prices ranging between $50 and $70 a barrel for much of the second half of the year. But the short term outlook, as I mentioned, is rather murky.
Technical outlook
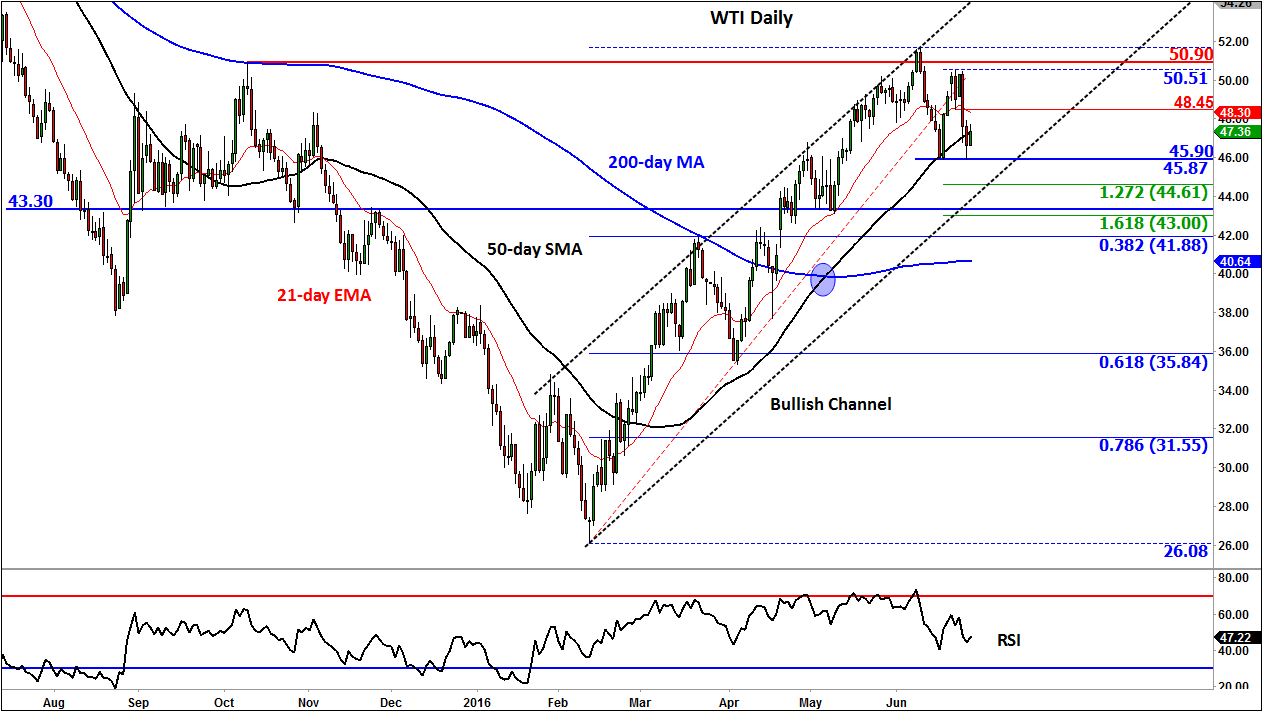
WTI’s struggles continue ever since it formed a false break above the October 2015 high of $50.90 at the start of the month. It has since formed a lower high at $50.50 but is yet to make a new lower low underneath $45.85/90 area. Even if it does, this could mark a potential ABC move into the support trend of the long-term bullish channel, which resides around the $44 area. However a closing break below the support trend of the channel would probably signal the end of the still-bullish trend. Indeed, the trend is still objectively bullish – it must be pointed out – given that both the 50 and now the 200 day moving averages are pointing higher. But these averages are obviously lagging and it is price action that needs be watched more closely.
StoneX Financial Ltd (trading as “City Index”) is an execution-only service provider. This material, whether or not it states any opinions, is for general information purposes only and it does not take into account your personal circumstances or objectives. This material has been prepared using the thoughts and opinions of the author and these may change. However, City Index does not plan to provide further updates to any material once published and it is not under any obligation to keep this material up to date. This material is short term in nature and may only relate to facts and circumstances existing at a specific time or day. Nothing in this material is (or should be considered to be) financial, investment, legal, tax or other advice and no reliance should be placed on it.
No opinion given in this material constitutes a recommendation by City Index or the author that any particular investment, security, transaction or investment strategy is suitable for any specific person. The material has not been prepared in accordance with legal requirements designed to promote the independence of investment research. Although City Index is not specifically prevented from dealing before providing this material, City Index does not seek to take advantage of the material prior to its dissemination. This material is not intended for distribution to, or use by, any person in any country or jurisdiction where such distribution or use would be contrary to local law or regulation.
For further details see our full non-independent research disclaimer and quarterly summary.
CFDs are complex instruments and come with a high risk of losing money rapidly due to leverage. 69% of retail investor accounts lose money when trading CFDs with this provider. You should consider whether you understand how CFDs work and whether you can afford to take the high risk of losing your money. CFD and Forex Trading are leveraged products and your capital is at risk. They may not be suitable for everyone. Please ensure you fully understand the risks involved by reading our full risk warning.
City Index is a trading name of StoneX Financial Ltd. Head and Registered Office: 1st Floor, Moor House, 120 London Wall, London, EC2Y 5ET. StoneX Financial Ltd is a company registered in England and Wales, number: 05616586. Authorised and regulated by the Financial Conduct Authority. FCA Register Number: 446717.
City Index is a trademark of StoneX Financial Ltd.
The information on this website is not targeted at the general public of any particular country. It is not intended for distribution to residents in any country where such distribution or use would contravene any local law or regulatory requirement.
© City Index 2024