Crude off highs as traders weigh impact of Canada fire Saudi s new oil chief
At the start of this week, oil prices found themselves sharply higher with Brent almost reaching $46.50 and WTI $46 a barrel overnight. Support for oil prices is coming from Canada due to the ongoing wildfires, which has reportedly reduced the nation’s daily crude output by a fifth already. Unfortunately it could take a very long time before the fire is brought under full control so its impact on oil production remains unclear. But this is obviously a temporary factor so it won’t have a long-lasting impact on prices. Both contracts eased off their highs by midday in London. The sacking of Saudi’s Ali al-Naimi as head of the country’s oil ministry may be a reason why oil prices have failed to maintain their early advance. Al-Naimi’s successor, Khalid al-Falih, the former head of the state-owned Aramco, is largely expected to follow the strategy of protecting the nation’s market share. This has further reduced the likelihood of an oil-freeze deal with other large non-OPEC producers like Russia.
In fact, oil prices haven’t moved much since the start of May. Profit-taking was largely the reason behind the oil price declines since the end of April after speculative net long positions had risen to record levels in the preceding weeks. Indeed, the CFTC’s latest positioning data on Friday revealed that bullish bets on WTI oil prices dropped for the first time in three weeks and short positions rose in the week to May 3. The selling continued in the early parts of last week, though prices recovered as the week wore on. The impact of another build in US oil inventories was offset by concerns about disruptions to oil supply in Canada – as a result of the wildfire in Fort McMurray, the country’s oil sands hub. Friday’s disappointing US jobs report saw traders revise their expectations about a rate increase further out, triggering a “risk on” rally from which oil also benefitted.
Essentially, though oil prices still appear to be in an upward trend. It is expectations about a tighter global oil market this year that has been driving prices from the multi-year lows hit in February. Above all, the declines in US shale oil production look set to continue for some time yet as the rig counts continue to fall. According to Baker Hughes, another 4 US oil rigs were taken out of operation last week. In April, the average US rig count was 437, down 41 from the previous month and a huge 539 from April 2015. But it is not just the North America where oil rigs are falling. The international rig count (which excludes the US and Canada) fell by 39 in April compared to March, led by a drop of 15 rigs in Latin America.
But as oil prices trade near the lower band of the levels that many think will put the brakes on the decline in US oil production (namely around $50-$70 a barrel), it will be interesting to monitor the changes in the weekly oil rig counts in the coming months. Actual oil production will obviously also respond to higher prices but with a longer lag. If we start to see a slowdown in the decline in oil rig counts in the coming months then this may provide an early indication that oil prices are about to hit a medium term peak. Conversely, if the relentless declines continue then it would strongly suggest that prices may rise towards $70 or so before peaking.
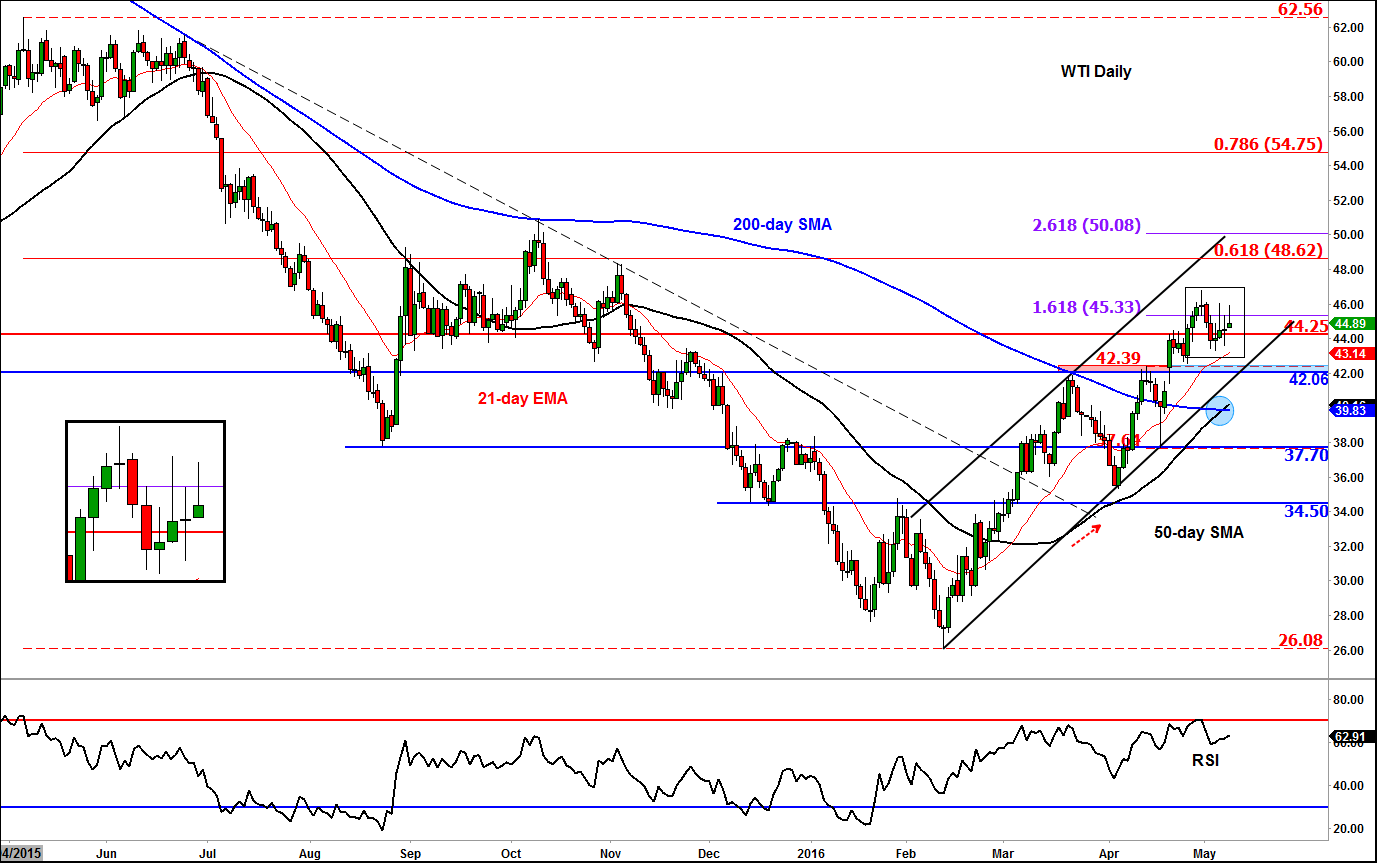
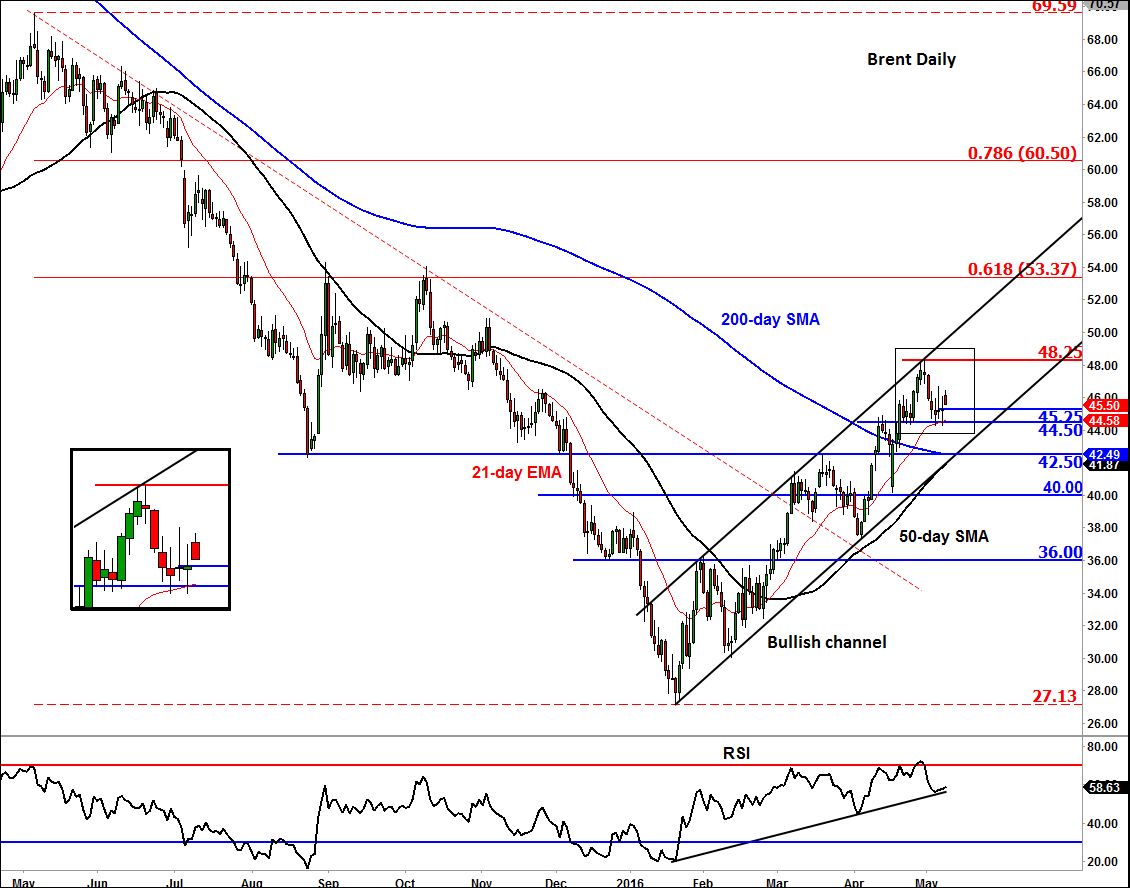
However the path of least resistance remains to the upside for now as both oil contracts remain inside their bullish channels and above key support levels as shown on their charts, below. WTI’s 50-day moving average has now crossed above the 200 to create a “Golden Crossover.” Meanwhile, Brent’s RSI has now worked off “overbought” condition, potentially paving the way for another rally this week, assuming that the key short-term support at $44.50 will hold. If this breaks however, we may see a drop towards $42.50, the support trend of the bullish channel and the 200-day moving average.
StoneX Financial Ltd (trading as “City Index”) is an execution-only service provider. This material, whether or not it states any opinions, is for general information purposes only and it does not take into account your personal circumstances or objectives. This material has been prepared using the thoughts and opinions of the author and these may change. However, City Index does not plan to provide further updates to any material once published and it is not under any obligation to keep this material up to date. This material is short term in nature and may only relate to facts and circumstances existing at a specific time or day. Nothing in this material is (or should be considered to be) financial, investment, legal, tax or other advice and no reliance should be placed on it.
No opinion given in this material constitutes a recommendation by City Index or the author that any particular investment, security, transaction or investment strategy is suitable for any specific person. The material has not been prepared in accordance with legal requirements designed to promote the independence of investment research. Although City Index is not specifically prevented from dealing before providing this material, City Index does not seek to take advantage of the material prior to its dissemination. This material is not intended for distribution to, or use by, any person in any country or jurisdiction where such distribution or use would be contrary to local law or regulation.
For further details see our full non-independent research disclaimer and quarterly summary.
CFDs are complex instruments and come with a high risk of losing money rapidly due to leverage. 69% of retail investor accounts lose money when trading CFDs with this provider. You should consider whether you understand how CFDs work and whether you can afford to take the high risk of losing your money. CFD and Forex Trading are leveraged products and your capital is at risk. They may not be suitable for everyone. Please ensure you fully understand the risks involved by reading our full risk warning.
City Index is a trading name of StoneX Financial Ltd. Head and Registered Office: 1st Floor, Moor House, 120 London Wall, London, EC2Y 5ET. StoneX Financial Ltd is a company registered in England and Wales, number: 05616586. Authorised and regulated by the Financial Conduct Authority. FCA Register Number: 446717.
City Index is a trademark of StoneX Financial Ltd.
The information on this website is not targeted at the general public of any particular country. It is not intended for distribution to residents in any country where such distribution or use would contravene any local law or regulatory requirement.
© City Index 2024