Crude no end in sight for oil s bear trend
Yesterday’s sharp rally in oil was halted, with WTI giving up its entire gains before the official weekly crude stockpiles report was released today. Evidently, traders were unnerved by the American Petroleum Institute’s (API) inventories report that was released last night, which showed a surprisingly large build of 2.9 million barrels when a small draw was expected. The US Depart of Energy reported similar numbers today, with total crude oil stockpiles rising by 2.6 million and distillate inventories 1.8 million barrels. Crude stocks at Cushing rose 0.9 million barrels to a record level.
As most of the bad news was already priced in after the API had reported similar numbers last night, US oil extended its losses only moderately post the official data. Nevertheless, with US production growing for the last few weeks and global inventories being near storage limits this is yet another reminder that the supply glut could take a long time to clear which may mean even lower oil prices in the near term. In fact, Saudi Arabia is already planning for lower oil prices next year after the leading OPEC producer announced measures to boost non-oil revenues and cut spending. To make matters worse, Iran is ready to pump at least 500 million barrels of the stuff per day more as soon as Western sanctions on its oil are lifted, possibly in early 2016.
So, the outlook for crude oil heading into 2016 is not looking great. But the second half of the year could see WTI rise as some of the weaker oil producers in the US are forced out of the market amid the persistently weaker prices. When and at what price level will oil bottom out is a million dollar question, but for now at least there’s still no end in sight for this protracted bear trend in crude.
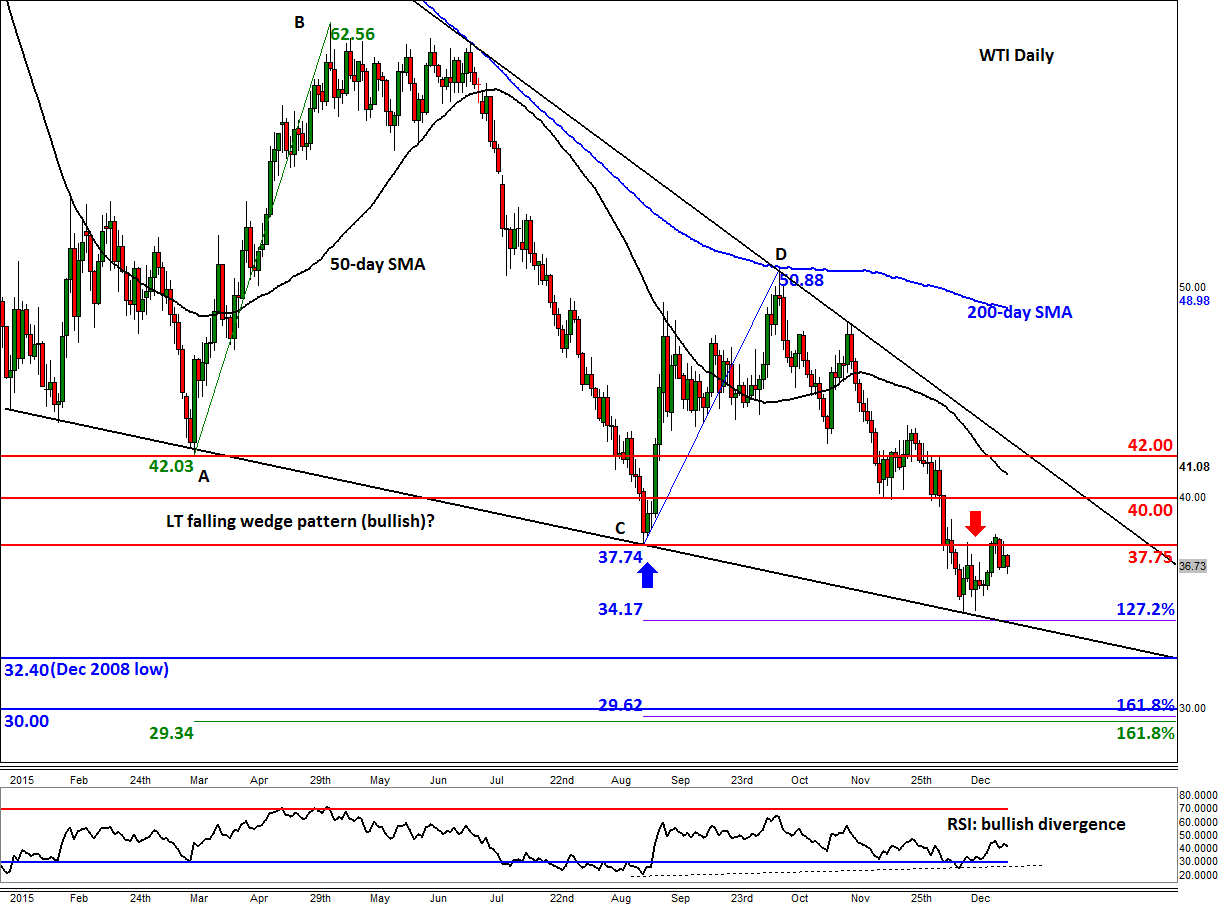
Yesterday’s gains also looked to have been driven mainly by sellers taking profit on their positions rather than actual buying. That’s because the downward pressure waned slightly last week as Brent tested its December 2008 low and WTI held its own above some short term support levels. But WTI was unable to move above the previous support at $37.75, and so traders were happy to sell the rally there. For as long as US oil holds below this level on a daily closing basis, the very short-term outlook will remain bearish. The next support for WTI is around $34.00/34.15, and area which corresponds with the 127.2% Fibonacci extension level of the most recent downswing and the support trend of a potential falling wedge pattern. Below that level is the December 2008 low at $32.40 and then the next psychologically important handle of $30.00 where we will also have a couple of Fibonacci extension levels converging. But if WTI manages to break decisively above the $37.75 resistance then the next stop could well be at $40.00, with the possibility of an eventual rally towards the resistance trend of the wedge pattern around $42.00.
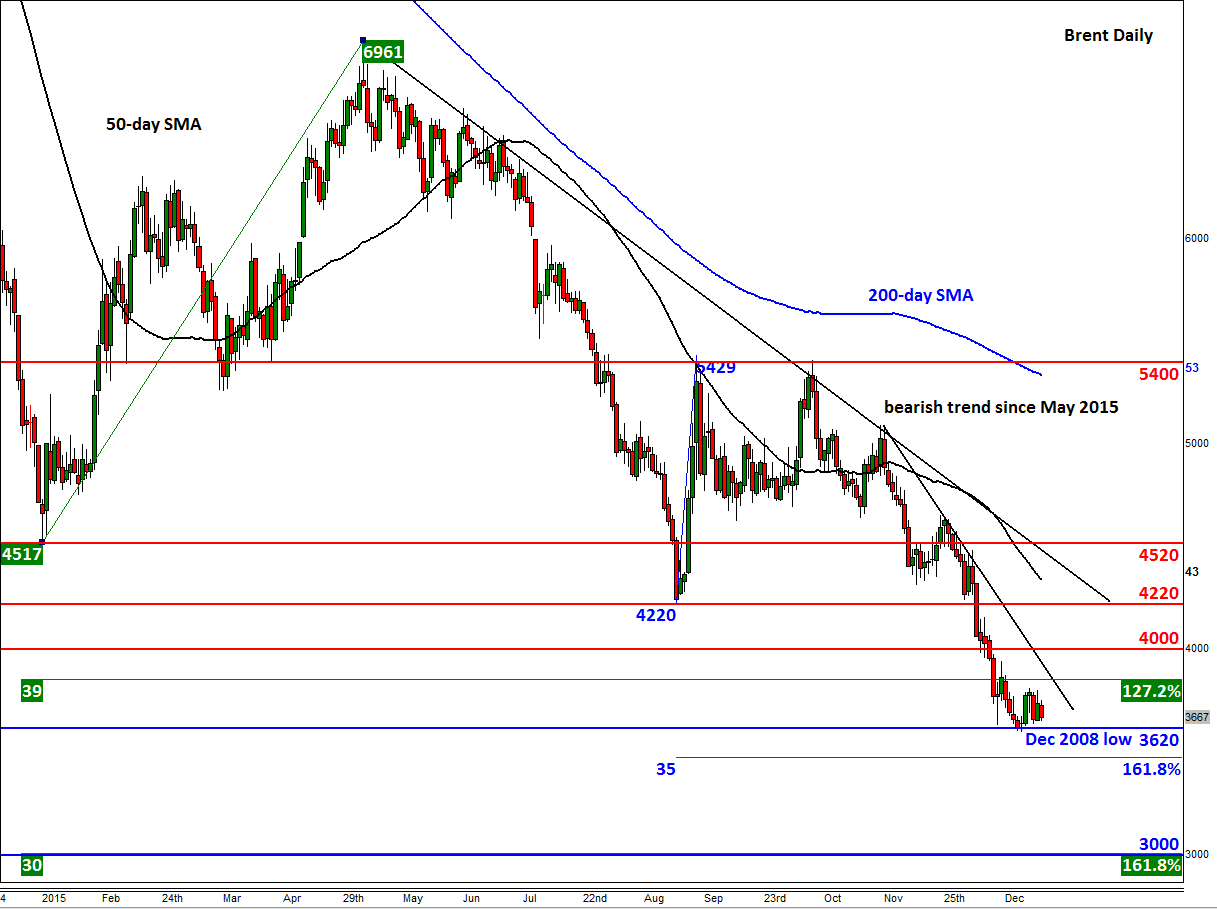
Brent meanwhile is hovering dangerously around the December 2008 low of $36.20. For the London-based oil contract, the next level to watch below here is the 161.8% extension level of the short-lived bounce we saw at the end of August, at $34.70. Then there is little further support until the next psychological level of $30, which also corresponds with the 161.8% extension of the larger bounce from the end of January/start of February. If Brent were to get to $30, we would therefore expect to see a bounce at the very least. On the upside, Brent faces several resistances including the bearish trend lines shown on the chart, the psychological $40 level and previous support at $42.20.
StoneX Financial Ltd (trading as “City Index”) is an execution-only service provider. This material, whether or not it states any opinions, is for general information purposes only and it does not take into account your personal circumstances or objectives. This material has been prepared using the thoughts and opinions of the author and these may change. However, City Index does not plan to provide further updates to any material once published and it is not under any obligation to keep this material up to date. This material is short term in nature and may only relate to facts and circumstances existing at a specific time or day. Nothing in this material is (or should be considered to be) financial, investment, legal, tax or other advice and no reliance should be placed on it.
No opinion given in this material constitutes a recommendation by City Index or the author that any particular investment, security, transaction or investment strategy is suitable for any specific person. The material has not been prepared in accordance with legal requirements designed to promote the independence of investment research. Although City Index is not specifically prevented from dealing before providing this material, City Index does not seek to take advantage of the material prior to its dissemination. This material is not intended for distribution to, or use by, any person in any country or jurisdiction where such distribution or use would be contrary to local law or regulation.
For further details see our full non-independent research disclaimer and quarterly summary.
CFDs are complex instruments and come with a high risk of losing money rapidly due to leverage. 69% of retail investor accounts lose money when trading CFDs with this provider. You should consider whether you understand how CFDs work and whether you can afford to take the high risk of losing your money. CFD and Forex Trading are leveraged products and your capital is at risk. They may not be suitable for everyone. Please ensure you fully understand the risks involved by reading our full risk warning.
City Index is a trading name of StoneX Financial Ltd. Head and Registered Office: 1st Floor, Moor House, 120 London Wall, London, EC2Y 5ET. StoneX Financial Ltd is a company registered in England and Wales, number: 05616586. Authorised and regulated by the Financial Conduct Authority. FCA Register Number: 446717.
City Index is a trademark of StoneX Financial Ltd.
The information on this website is not targeted at the general public of any particular country. It is not intended for distribution to residents in any country where such distribution or use would contravene any local law or regulatory requirement.
© City Index 2024