Crude holding up well despite more bearish news
Judging by today’s and most recent price action, crude oil is continuing to shrug off bearish news. This suggests that most of the negative news may now be priced in, which in turn implies that prices may have hit a bottom. But it is still early days and there are no concrete signals to confirm this thesis. Therefore, crude oil speculators should proceed with extra caution now and trade what they see rather than what they would like to see on their charts.
Today, for example, the US Energy Information Administration (EIA) published its weekly crude oil stocks data which showed that inventories rose for a second straight week, this time by an above-forecast 2.6 million barrels as refineries processed less crude now that the US driving season is about to end. Although WTI initially fell on the back of this, prices have since bounced back and both contracts are trading higher at the time of this writing. What’s more, the EIA has also revised down its demand forecast for global oil demand to just 1.2 million barrels per day this year and by 1.3m bpd next. Given all this seemingly bearish news, oil prices ‘should’ be going lower. Admittedly, part of the reason why prices have held up this well is due to the fact that there has been a small drop in US oil production. According to the EIA, US oil output fell by 140,000 bpd in August from July and is expected to decline further until it bottoms out in August 2016. On top of this, as per Baker Hughes data, US drillers idled rigs last week for the first time in seven weeks, which point to lower crude production levels.
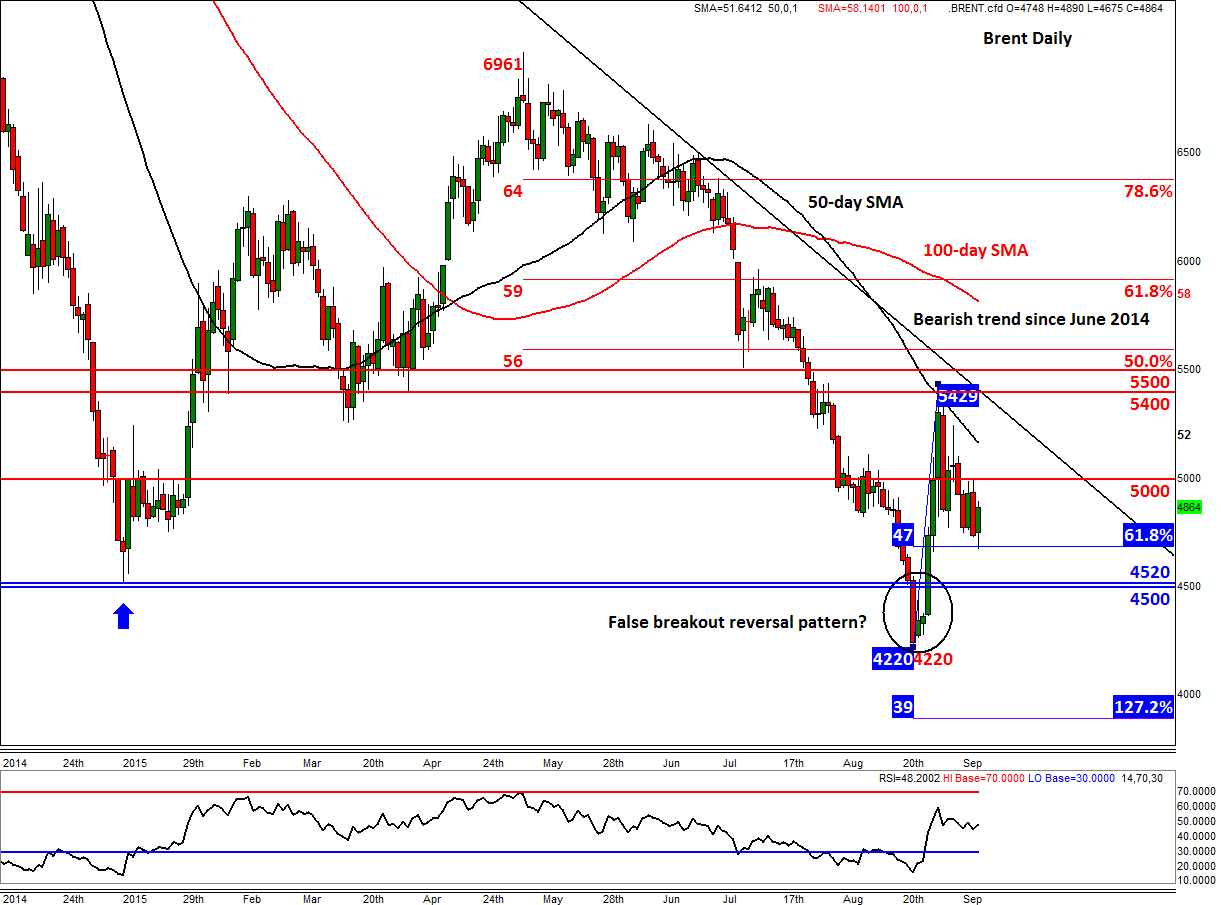
Nevertheless it appears as though most of the bearish news is now priced in. Indeed, from a technical point of view crude oil may have already formed a base when prices formed apparent false breakdown reversal patterns below their prior 2015 lows: Brent’s brief stint below the $45 handle and WTI’s short stay beneath $42.00. A false breakout pattern clearly shows the lack of willingness from traders to commit fresh funds at extreme levels, such as those just mentioned. Typically when this pattern first forms, prices stage sharp counter-trend moves that lasts for several days before going into consolidation and then the trend reverses for good. In the case of oil, prices rallied a good 25% off their lows before both contracts lost steam around their respective 50-day moving averages last week. Oil prices have since been falling or effectively consolidating in wide trading ranges.
Now that we have seen deep price retracements, we are potentially getting closer to the key turning points for crude oil. In fact, Brent may have already reached this turning point around $46.75 per barrel this morning. As can be seen from the chart, this level corresponds with the 61.8% Fibonacci retracement of the most recent upswing. If we have indeed seen a bottom for oil, Brent will need to hold above this level now. Even if it drops a little bit further, the abovementioned bullish setup would still remain valid. However a closing break below the previous support at $45 would invalidate the signal.
Crude oil bulls will now want to see the breakdown of some key resistance levels, starting with $50 on Brent. Thereafter the next key resistance is at around $54/55 which in addition to be being formerly support/resistance, corresponds with the bearish trend line that has been in place since June 2014. A potential break above that area would target the 61.8% Fibonacci retracement of the downward move from May, at $59, followed by the May high itself of around $69.60 a barrel.
The bears meanwhile will now want to see Brent below the $45.00. If realised, a move down towards at least the August low of $42.20 would then become very likely.
StoneX Financial Ltd (trading as “City Index”) is an execution-only service provider. This material, whether or not it states any opinions, is for general information purposes only and it does not take into account your personal circumstances or objectives. This material has been prepared using the thoughts and opinions of the author and these may change. However, City Index does not plan to provide further updates to any material once published and it is not under any obligation to keep this material up to date. This material is short term in nature and may only relate to facts and circumstances existing at a specific time or day. Nothing in this material is (or should be considered to be) financial, investment, legal, tax or other advice and no reliance should be placed on it.
No opinion given in this material constitutes a recommendation by City Index or the author that any particular investment, security, transaction or investment strategy is suitable for any specific person. The material has not been prepared in accordance with legal requirements designed to promote the independence of investment research. Although City Index is not specifically prevented from dealing before providing this material, City Index does not seek to take advantage of the material prior to its dissemination. This material is not intended for distribution to, or use by, any person in any country or jurisdiction where such distribution or use would be contrary to local law or regulation.
For further details see our full non-independent research disclaimer and quarterly summary.
CFDs are complex instruments and come with a high risk of losing money rapidly due to leverage. 69% of retail investor accounts lose money when trading CFDs with this provider. You should consider whether you understand how CFDs work and whether you can afford to take the high risk of losing your money. CFD and Forex Trading are leveraged products and your capital is at risk. They may not be suitable for everyone. Please ensure you fully understand the risks involved by reading our full risk warning.
City Index is a trading name of StoneX Financial Ltd. Head and Registered Office: 1st Floor, Moor House, 120 London Wall, London, EC2Y 5ET. StoneX Financial Ltd is a company registered in England and Wales, number: 05616586. Authorised and regulated by the Financial Conduct Authority. FCA Register Number: 446717.
City Index is a trademark of StoneX Financial Ltd.
The information on this website is not targeted at the general public of any particular country. It is not intended for distribution to residents in any country where such distribution or use would contravene any local law or regulatory requirement.
© City Index 2024