Crude have we seen a bottom for oil
Crude has recovered its earlier losses to turn slightly higher on the day. So far however there’s been little evidence of strong follow-through in momentum buying after yesterday’s sharp rally. If the buyers fail to show up now it would strongly suggest that the upsurge was probably due to short-covering and technical buying, rather than anything more concrete. But it could be that oil is finally responding to the general improvement in risk sentiment and could be about to embark on a significant rally. After all, most of the bad news is surely now priced in while the growth in supply may have peaked.
WTI gained over 6 per cent at one stage yesterday and Brent climbed almost 5%. The Energy Information Administration’s (EIA) latest crude stockpiles report for the week ending October 23 may have been a reason for the rally, although even before this came out oil was trading higher on the day. The EIA data showed another large build of 3.4 million barrels in commercial crude stocks, though the increase was slightly lower than expected and below the 4.1 million barrel build that was reported by the API the day before. What’s more, stocks at Cushing, the delivery point of the WTI contract, actually fell by 785,000 barrels. The report also revealed sharp draws in stocks of crude products, most notably distillates which fell by 3 million barrels. Gasoline stocks fell by 1.1m barrels. While there was a small increase in the utilization rate, refineries still processed less crude as some of them are going through seasonal maintenance works. In theory, demand should now pick up and crude inventories fall as more refineries return in the coming weeks in preparation for the winter.
Meanwhile the cancellations of major projects by oil companies – with Shell for example taking a hefty $8.6 billion charge in Q3 to cover the cost of the Alaskan drilling and the Carmon Creek oil sands project in Canada – suggests oil production is being scaled back and point to higher prices in the long run. But in the immediate term, the oil market remains excessively oversupplied and this is keeping price gains in check, though that’s not to say we won’t see big surges every now and again – like yesterday.
As far as today’s session is concerned, oil prices may be held back because of intensifying concerns about the health of US economy. Today for example saw the third quarter GDP miss the mark with only a 1.5% annualised increase in growth, while the monthly 2.3% drop in pending home sales took everyone by surprise. New home sales were also very weak as we found out at the start of the week, while on Tuesday durable goods orders and the Conference Board’s consumer confidence index both disappointed expectations. Yet at the same time, the dollar has been rallying as the Fed continues to talk up the prospects of a rate increase in December. That being said, the stronger dollar played no part in preventing WTI to surge higher yesterday, suggesting there must be some fundamental reason for prices to have rallied that sharply.
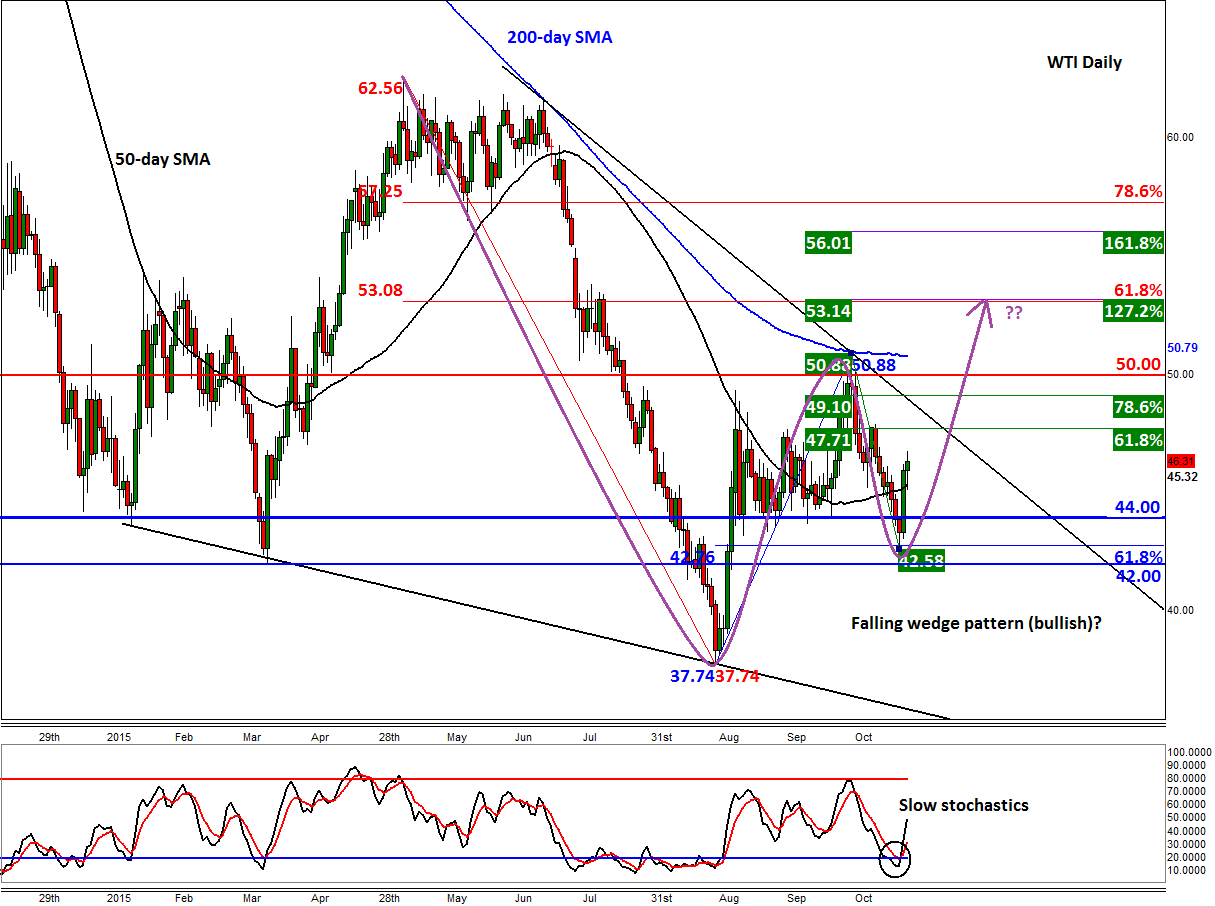
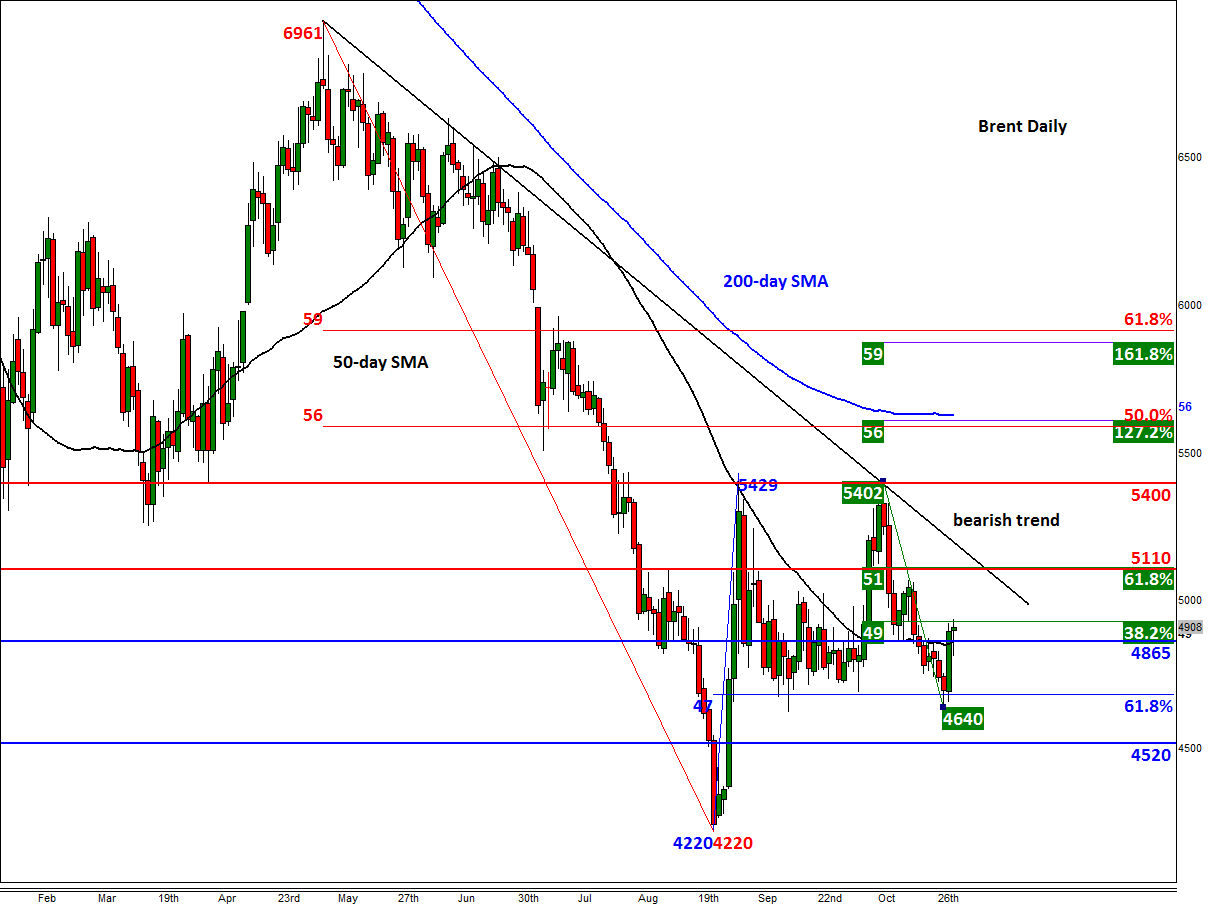
For now, the bearish trends are intact on both oil contracts so bullish traders should take the latest rally with a pinch of salt, as after all this is not the first time prices have rallied this sharply only to falter around key technical levels at some later point in time. In other words, be nimble. However it should be noted that if oil prices have already found a base at the end of August, then this could be the start of the next impulsive move higher. To confirm which group of market participants are in the driving seat – the buyers or the sellers – either a key support or resistance level now needs to break down. The key resistance for WTI is the bearish trend of the apparent falling wedge pattern that can be seen on the daily chart, which in itself is a bullish formation. This comes in somewhere between $48 and $49 a barrel. The previous resistance is around $50-$51, where we also have the 200-day moving average converging. A potential break above here could easily target the next set of Fibonacci-based targets, starting at $53.10 (61.8% retracement of the larger downswing with 127.2% extension of the most recent correction). On the other hand, a decisive break below $42 would completely invalidate this potentially bullish setup.
StoneX Financial Ltd (trading as “City Index”) is an execution-only service provider. This material, whether or not it states any opinions, is for general information purposes only and it does not take into account your personal circumstances or objectives. This material has been prepared using the thoughts and opinions of the author and these may change. However, City Index does not plan to provide further updates to any material once published and it is not under any obligation to keep this material up to date. This material is short term in nature and may only relate to facts and circumstances existing at a specific time or day. Nothing in this material is (or should be considered to be) financial, investment, legal, tax or other advice and no reliance should be placed on it.
No opinion given in this material constitutes a recommendation by City Index or the author that any particular investment, security, transaction or investment strategy is suitable for any specific person. The material has not been prepared in accordance with legal requirements designed to promote the independence of investment research. Although City Index is not specifically prevented from dealing before providing this material, City Index does not seek to take advantage of the material prior to its dissemination. This material is not intended for distribution to, or use by, any person in any country or jurisdiction where such distribution or use would be contrary to local law or regulation.
For further details see our full non-independent research disclaimer and quarterly summary.
CFDs are complex instruments and come with a high risk of losing money rapidly due to leverage. 69% of retail investor accounts lose money when trading CFDs with this provider. You should consider whether you understand how CFDs work and whether you can afford to take the high risk of losing your money. CFD and Forex Trading are leveraged products and your capital is at risk. They may not be suitable for everyone. Please ensure you fully understand the risks involved by reading our full risk warning.
City Index is a trading name of StoneX Financial Ltd. Head and Registered Office: 1st Floor, Moor House, 120 London Wall, London, EC2Y 5ET. StoneX Financial Ltd is a company registered in England and Wales, number: 05616586. Authorised and regulated by the Financial Conduct Authority. FCA Register Number: 446717.
City Index is a trademark of StoneX Financial Ltd.
The information on this website is not targeted at the general public of any particular country. It is not intended for distribution to residents in any country where such distribution or use would contravene any local law or regulatory requirement.
© City Index 2024