Crude extends decline on record OPEC oil output
Crude oil prices continue to head south. As before, they are being driven lower predominantly because of the disequilibrium created from the supply side of the equation. In fact, it is not just the actual supply but the expected growth in supply that are also weighing on prices. Although the demand outlook has improved somewhat, it is nowhere near strong enough to help offset the steep rises in supply. The latest manufacturing data from China does not bode well either.
Indeed, at just over 32 million barrels per day, the OPEC produced a lot more oil last month than was need. That’s according to the latest estimates from both Bloomberg and Reuters. Once again, it was the largest OPEC producers – Saudi and Iraq – that led the charge as they produced record amounts of the stuff due to their single focus of defending market share. Expectations about even higher levels of production from the OPEC are increasing. That’s because Iran may immediately raise its output by up to 500,000 barrels per day as soon as the US-led sanctions are lifted and then by a million bpd within a month according to Iran’s oil minister – previously it was thought that the country’s oil exports could hit the one million bpd mark within six months. Oil output from Libya continues to be hampered by the on-going conflicts between the government forces and the rebels. Thus, if the situation there were to improve then the excessive global supply situation could exacerbate.
Meanwhile in the US, the latest weekly rig count data from Baker Hughes has shown an increase of 5 to 664. Although admittedly this was a smaller rise compared to the prior week’s increase of 21, it is now the fourth time in 5 weeks that the number of rigs in use has risen. Shale producers are refusing to throw in the towel just yet and evidently production at these levels is still profitable for some. That probably explains why optimism among money managers continues to fall. The latest positioning data from the CFTC shows that net long positions fell to their lowest level since December 2012 after decreasing by another 7,700 contracts in the week to 28 July. As WTI prices have since fallen further, it is likely that the net longs were trimmed even more.
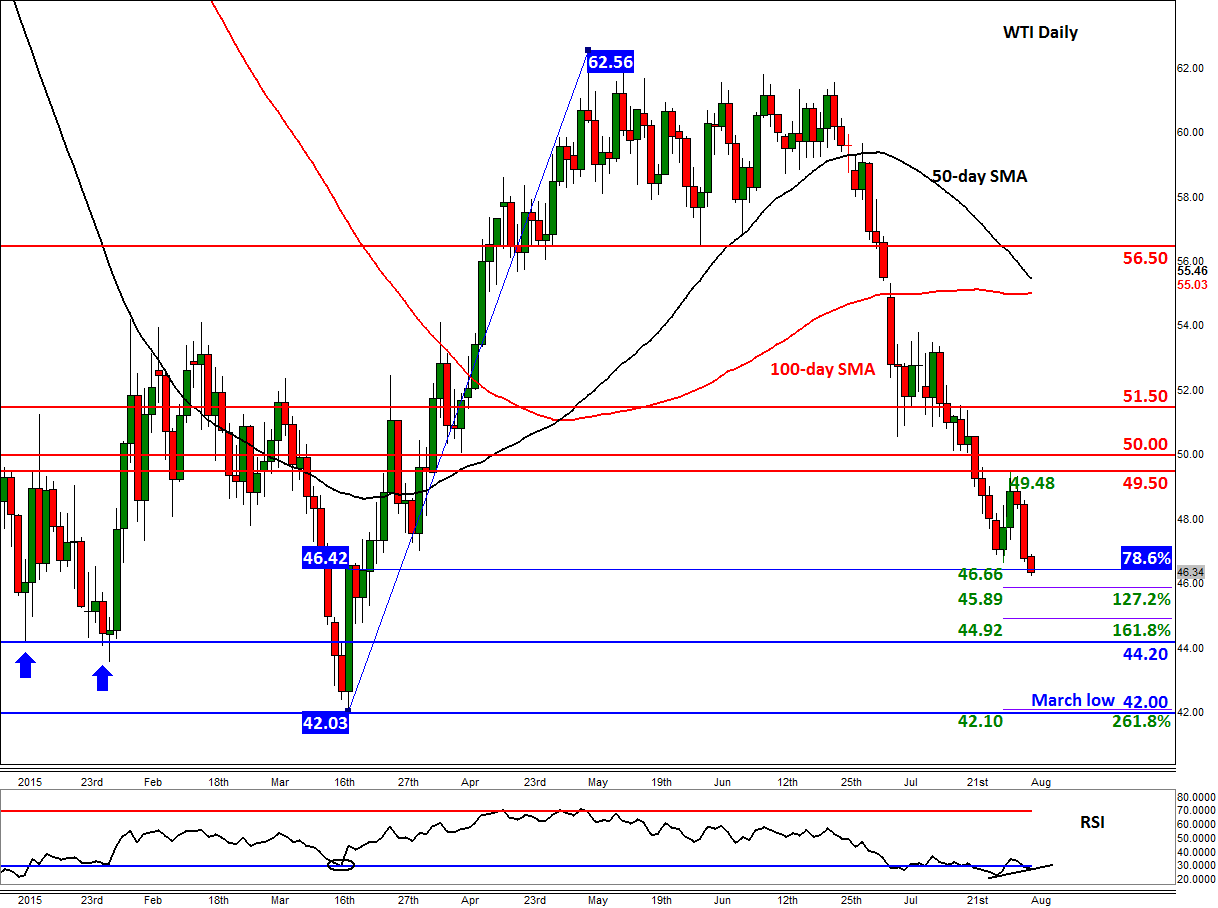
The chart of WTI is unsurprisingly looking anything but constructive. Support after support gets broken due to the abovementioned fundamental forces. As things stand, only a decisive break above the $49.50 resistance level would violate the bearish trend in the short term. Until and unless that happens, the path of least resistance therefore remains to the downside. As such, traders should continue to treat the key potential support levels that they see on their charts as profit-targets rather than long entry points. But apart from a few Fibonacci extension points, there is now not much support seen until $44.20 or the March low around $42.00. Meanwhile the momentum indicator RSI remains in the oversold territory and has not yet confirmed this latest lower low on underlying prices. Thus it points to a potential short-squeeze rally, so do watch out for that possible outcome.
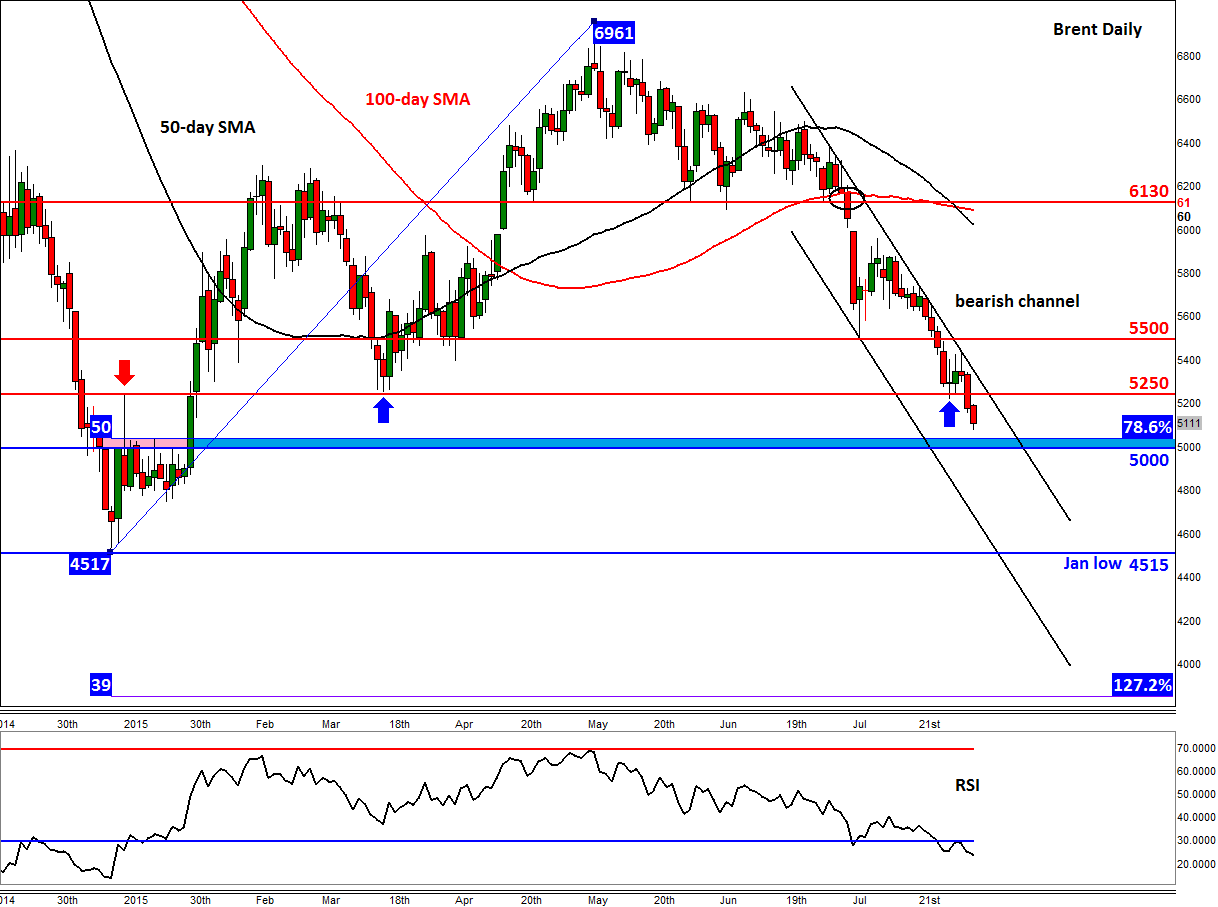
Brent is likewise creating lower lows as it descends towards fresh multi-month lows inside a bearish channel. Having broken the key support at $52.50, this level could now turn into resistance upon re-test. The next potential support to watch is around the $50.00-$50.50 area. Here, the psychologically-important level ties in with the 78.6% Fibonacci retracement level of the upswing from the January low. If broken, the January low itself at $45.20 could be the next target for the bears. As things stand, a decisive break above the key resistance at $55.00 could be a bullish development – the chances of that happening are slim however…
StoneX Financial Ltd (trading as “City Index”) is an execution-only service provider. This material, whether or not it states any opinions, is for general information purposes only and it does not take into account your personal circumstances or objectives. This material has been prepared using the thoughts and opinions of the author and these may change. However, City Index does not plan to provide further updates to any material once published and it is not under any obligation to keep this material up to date. This material is short term in nature and may only relate to facts and circumstances existing at a specific time or day. Nothing in this material is (or should be considered to be) financial, investment, legal, tax or other advice and no reliance should be placed on it.
No opinion given in this material constitutes a recommendation by City Index or the author that any particular investment, security, transaction or investment strategy is suitable for any specific person. The material has not been prepared in accordance with legal requirements designed to promote the independence of investment research. Although City Index is not specifically prevented from dealing before providing this material, City Index does not seek to take advantage of the material prior to its dissemination. This material is not intended for distribution to, or use by, any person in any country or jurisdiction where such distribution or use would be contrary to local law or regulation.
For further details see our full non-independent research disclaimer and quarterly summary.
CFDs are complex instruments and come with a high risk of losing money rapidly due to leverage. 69% of retail investor accounts lose money when trading CFDs with this provider. You should consider whether you understand how CFDs work and whether you can afford to take the high risk of losing your money. CFD and Forex Trading are leveraged products and your capital is at risk. They may not be suitable for everyone. Please ensure you fully understand the risks involved by reading our full risk warning.
City Index is a trading name of StoneX Financial Ltd. Head and Registered Office: 1st Floor, Moor House, 120 London Wall, London, EC2Y 5ET. StoneX Financial Ltd is a company registered in England and Wales, number: 05616586. Authorised and regulated by the Financial Conduct Authority. FCA Register Number: 446717.
City Index is a trademark of StoneX Financial Ltd.
The information on this website is not targeted at the general public of any particular country. It is not intended for distribution to residents in any country where such distribution or use would contravene any local law or regulatory requirement.
© City Index 2024