Crude commodities stabilise outlook remains bleak
Commodity prices have been more stable since Wednesday. Gold is now up for the third consecutive day, copper has halted its decline and oil is trading sideways. While gold has been underpinned by a slightly weaker dollar due to growing expectations of a so-called dovish rate hike from the Fed, copper is getting a boost in part from zinc, which has rallied sharply after ten Chinese smelters said in a joint statement they would cut output by 500,000 tonnes next year, reasoning that the current weak prices do not reflect the fundamentals. Commodity giant Glencore is already reducing copper production, though so far this has had little or no impact on the metal’s price. Nevertheless, concerns over China appear to have diminished somewhat, so copper could find a near-term base soon, though the long-term trend remains decisively bearish – and not just for copper.
Meanwhile crude oil has shown signs of stabilization though the bears keep knocking it down each time it tries to break higher. Traders are clearly finding it difficult whether to focus on the short-term bearish or the slightly longer-term bullish supply and demand factors. As things stand, it looks as though not many people are convinced that we will see a notable destocking in global crude stockpiles any time soon, even if the latest US oil inventories data shows that the pace of the builds there has slowed down. So, oil prices could fall further before we see a noticeable bounce, though that being said they do look severally oversold in the short-term. Baker Hughes will report its latest rig counts data later on. The number of active rigs has been consistently falling in recent times as oil prices continue to remain depressed. So far, short-term speculators have hardly reacted to the falls but essentially it does point to a tighter market in 2016. So we could be very close to the bottom for oil.
Technical outlook: Brent
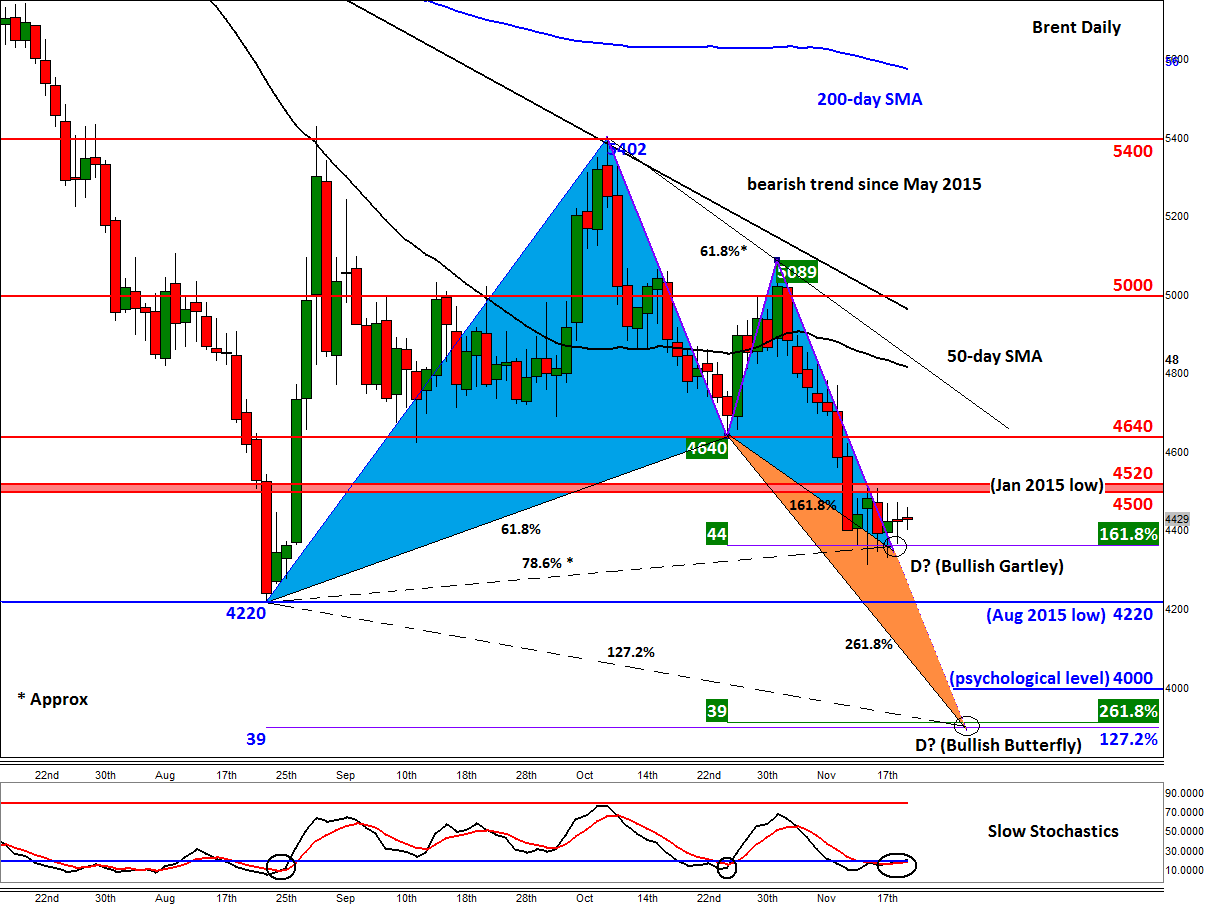
How low can oil go? Brent has found decent support around the $43.50 – $44.00 price range following a big drop recently. As can be seen on the chart, a couple of Fibonacci levels converge with the point D of an AB=CD move here. So, we have a Bullish Gartley pattern here, which can sometimes pinpoint major lows and highs in the markets. So far this pattern is just about holding and we are yet to see a rally. So, at this stage, the bulls should proceed with extreme caution since they would be going against the underlying bearish trend. But if resistance at the $45.00-$45.20 region breaks, then we may see a more aggressive rally at least towards the bearish trends and the 50-day moving average, around $48.00. Supporting the bullish case here is the fact that the Slow Stochastics indicator is at the oversold threshold and potentially about to form a bullish crossover.
Conversely, if oil breaks below the abovementioned Bullish Gartley support then the next logical target for the bears would be the August low around $42.20. Though there is a possibility for Brent to form a double bottom here, there’s greater risk that it could even extend its drop towards the next psychological level at $40 a barrel. Should we get to these levels, the longer-term bears would need to be extremely cautious for there is a more significant harmonic price pattern that could provide a floor to prices: a Bullish Butterfly around $39. This formation is the same as the Gartley in that it is constructed by Fibonacci levels, but the point D comes in below the 100% retracement of XA, in this case at the 127.2% extension level. The CD leg is also extended – in this case, by 161.8 per cent times AB. The area around $39 is also where the 261.8% of the BC move resides, thus making it an exhaustion point. But will oil even get to $39 and even if it does, will necessarily form a major base? Indeed, we could simply see a short-term bounce, before the trend resumes and oil prices fall further. So treat all these Gartley/Butterfly and indeed any other technical patterns with caution, especially when going against the underlying trend.
StoneX Financial Ltd (trading as “City Index”) is an execution-only service provider. This material, whether or not it states any opinions, is for general information purposes only and it does not take into account your personal circumstances or objectives. This material has been prepared using the thoughts and opinions of the author and these may change. However, City Index does not plan to provide further updates to any material once published and it is not under any obligation to keep this material up to date. This material is short term in nature and may only relate to facts and circumstances existing at a specific time or day. Nothing in this material is (or should be considered to be) financial, investment, legal, tax or other advice and no reliance should be placed on it.
No opinion given in this material constitutes a recommendation by City Index or the author that any particular investment, security, transaction or investment strategy is suitable for any specific person. The material has not been prepared in accordance with legal requirements designed to promote the independence of investment research. Although City Index is not specifically prevented from dealing before providing this material, City Index does not seek to take advantage of the material prior to its dissemination. This material is not intended for distribution to, or use by, any person in any country or jurisdiction where such distribution or use would be contrary to local law or regulation.
For further details see our full non-independent research disclaimer and quarterly summary.
CFDs are complex instruments and come with a high risk of losing money rapidly due to leverage. 69% of retail investor accounts lose money when trading CFDs with this provider. You should consider whether you understand how CFDs work and whether you can afford to take the high risk of losing your money. CFD and Forex Trading are leveraged products and your capital is at risk. They may not be suitable for everyone. Please ensure you fully understand the risks involved by reading our full risk warning.
City Index is a trading name of StoneX Financial Ltd. Head and Registered Office: 1st Floor, Moor House, 120 London Wall, London, EC2Y 5ET. StoneX Financial Ltd is a company registered in England and Wales, number: 05616586. Authorised and regulated by the Financial Conduct Authority. FCA Register Number: 446717.
City Index is a trademark of StoneX Financial Ltd.
The information on this website is not targeted at the general public of any particular country. It is not intended for distribution to residents in any country where such distribution or use would contravene any local law or regulatory requirement.
© City Index 2024