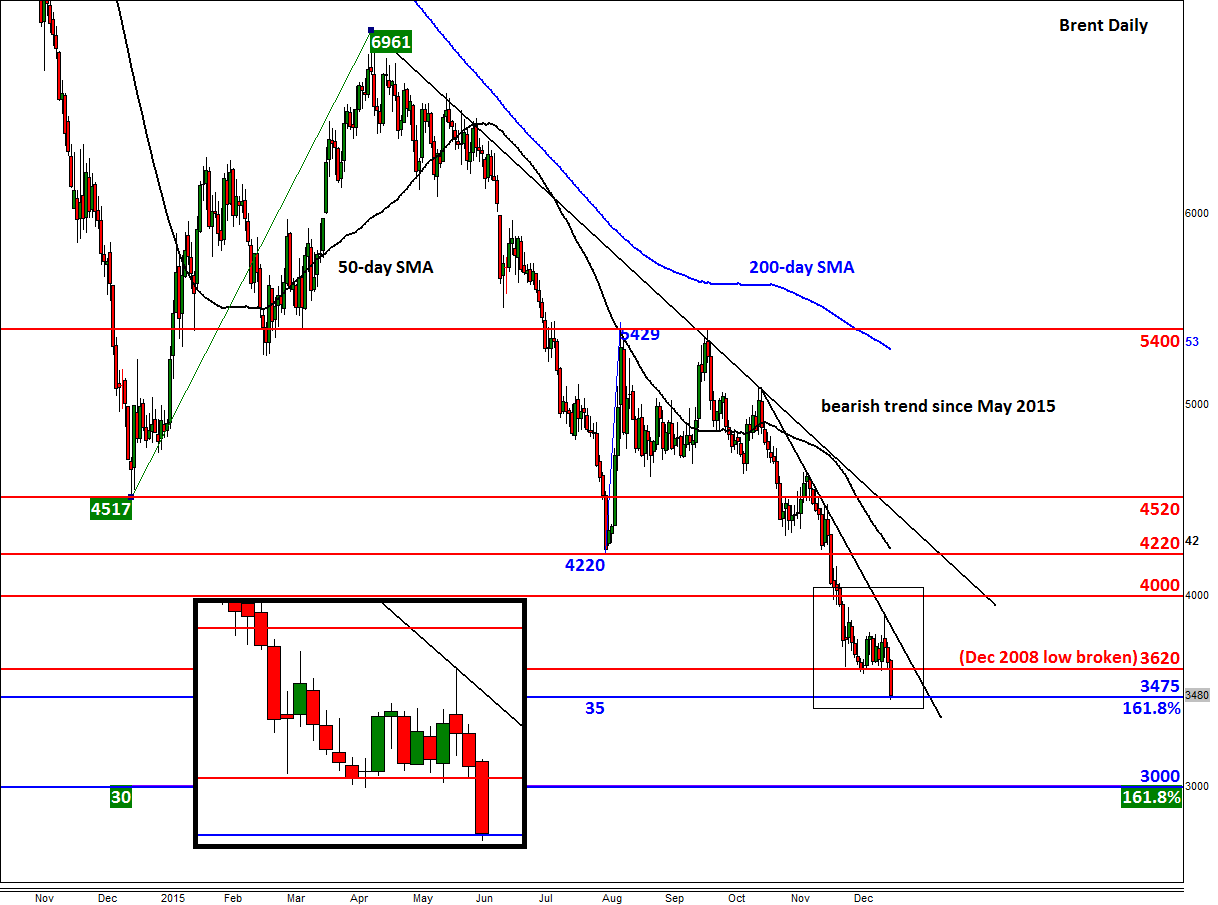
Crude Brent drops to fresh 11 year low as WTI slips below 35 ahead of stocks data
Oil remains on a slippery slope. Brent fell below $35 a barrel this morning to reach its lowest price level since July 2004. WTI also dropped below the $35 handle to trade near the lows it had hit in December of last year. The gap between the two contracts has virtually vanished in recent days. Previously, the supply glut was mainly confined to the US, and while the situation there hasn’t changed much the excess has also become apparent outside of the US over the past year or so. Afraid of losing market share, OPEC producers are pumping the stuff at full throttle. Yesterday, a Reuters survey of OPEC production revealed that Saudi’s oil output for December averaged 10.15 million barrels per day. The cartel’s largest producer has maintained its crude output above the 10 million bpd mark for nine consecutive months. Saudi is thus showing no sign of reducing its production to make room for Iranian oil when international sanctions on Tehran are lifted this year. As I have said previously, the recent rise in tensions between Saudi and Iran just means even less coordination within the OPEC in terms of controlling oil supply, not that there was much of a commitment in this regard anyway. So, although geopolitical risks may have increased in the region, this time it is unlikely to be oil-positive as it won’t affect supply. The on-going volatility in the stock markets, coupled with concerns about the health of the Chinese economy, means there is no reason for investors to expect a sudden jump in demand growth this year. So, there is still no end in sight for the slump in oil. Saudi has also reduced its February prices to customers in Europe. This means they remain committed to defending their market share and is undoubtedly another bearish piece of news for oil.
In the US, crude oil inventories have been rising and destocking has been minimal at best in recent times. However, the American Petroleum Institute (API) reported last night that crude stocks fell by a surprisingly large 5.6 million barrels for the week ended January 1. On the surface, this should have been good news, but as always the devil is in the detail. The API said crude stocks at the Cushing hub climbed by 1.4 million barrels, while stocks of crude products surged: gasoline by 7.1 million and distillates by 5.6 million barrels, undoubtedly due to milder weather reducing the need for heating. The official US crude oil inventories data from the Energy Information Administration (EIA) will be released at 15:30 GMT (10:30 ET). Unless the EIA data shows something surprisingly more positive, WTI oil is likely to head further lower now that Brent has dropped to a fresh 11-year low.
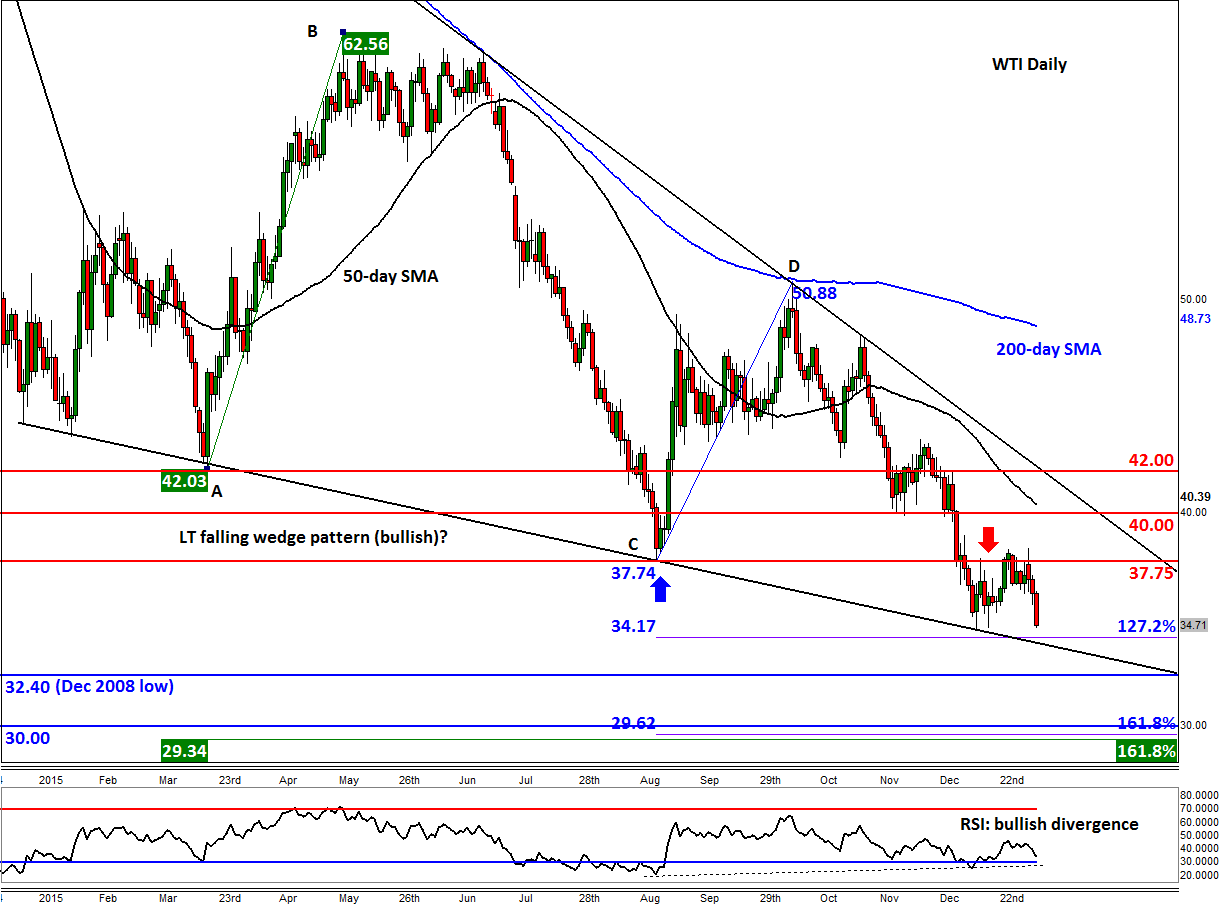
At the time of this writing, WTI was just 20 cents shy of the December 2015 low at 34.50 and not too far off the lower trend of a potential falling wedge pattern around the 127.2% Fibonacci extension level at $34.15. The December 2008 low comes in at $32.40, followed by the psychologically-important $30 handle next. At this stage, a decisive break above previous support-turned-resistance at $37.75 is needed in order to end the very short term bearish bias. But the RSI is in the state of a bullish divergence, which suggests that the bearish momentum may be fading. IF WTI goes on to break higher, it will still have to face several other important resistance levels such as $40.00 and $42.00.
As mentioned, Brent crude has already moved below the December 2008 low of $36.20 today to trade at its lowest level since July 2004, possibly paving the way for a drop to $30 a barrel next where it will also meet the 161.8% Fibonacci extension level of the upswing we saw at the start of last year. Should it get to this psychological level, we would then expect to see at the very least a bounce there. At the time of this writing though, the London-based oil contract was testing the 161.8% Fibonacci extension level of another price swing at $34.75. Ahead of US oil inventories data, we may see some profit-taking at these levels.
StoneX Financial Ltd (trading as “City Index”) is an execution-only service provider. This material, whether or not it states any opinions, is for general information purposes only and it does not take into account your personal circumstances or objectives. This material has been prepared using the thoughts and opinions of the author and these may change. However, City Index does not plan to provide further updates to any material once published and it is not under any obligation to keep this material up to date. This material is short term in nature and may only relate to facts and circumstances existing at a specific time or day. Nothing in this material is (or should be considered to be) financial, investment, legal, tax or other advice and no reliance should be placed on it.
No opinion given in this material constitutes a recommendation by City Index or the author that any particular investment, security, transaction or investment strategy is suitable for any specific person. The material has not been prepared in accordance with legal requirements designed to promote the independence of investment research. Although City Index is not specifically prevented from dealing before providing this material, City Index does not seek to take advantage of the material prior to its dissemination. This material is not intended for distribution to, or use by, any person in any country or jurisdiction where such distribution or use would be contrary to local law or regulation.
For further details see our full non-independent research disclaimer and quarterly summary.
CFDs are complex instruments and come with a high risk of losing money rapidly due to leverage. 69% of retail investor accounts lose money when trading CFDs with this provider. You should consider whether you understand how CFDs work and whether you can afford to take the high risk of losing your money. CFD and Forex Trading are leveraged products and your capital is at risk. They may not be suitable for everyone. Please ensure you fully understand the risks involved by reading our full risk warning.
City Index is a trading name of StoneX Financial Ltd. Head and Registered Office: 1st Floor, Moor House, 120 London Wall, London, EC2Y 5ET. StoneX Financial Ltd is a company registered in England and Wales, number: 05616586. Authorised and regulated by the Financial Conduct Authority. FCA Register Number: 446717.
City Index is a trademark of StoneX Financial Ltd.
The information on this website is not targeted at the general public of any particular country. It is not intended for distribution to residents in any country where such distribution or use would contravene any local law or regulatory requirement.
© City Index 2024