Crude arrives at key technical juncture ahead of stocks data
Crude oil has now fallen for the third consecutive trading day. Despite the significantly weaker prices, sentiment remains decisively bearish, in part because of the lack any significantly bullish fundamental factors. So, the situation is still the same, which is that the oil market remains significantly oversupplied. Over the past couple of weeks, US crude stocks have risen noticeably sharply, which admittedly has been due to seasonal factors as many refineries are shut because of maintenance works. Another sharp build in inventories is what many people fear we will see from the API and EIA’s weekly reports, which will be published tonight and tomorrow, respectively. Traders are also concerned that the global excess will still be in place for much of 2016 as potential increases of Iranian supplies and elsewhere will simply offset the expected falls in US oil output. The fact that economic growth in China and elsewhere has slowed down recently means that the growth in oil demand will also likely to be weaker which therefore means that the rebalancing of the market will take longer to achieve than expected. Indeed, demand concerns could come to the forefront of investors’ minds if the third quarter US GDP estimate disappoints expectations on Thursday.
But I wonder how much of all this negativity is already priced in and as such I don’t envisage there to be further vicious drops in oil prices. So we may see some consolidation around the current levels until we see more evidence that US oil production is indeed going to be reduced in a meaningful way. Even so, the potential gains could be limited.
Technical outlook
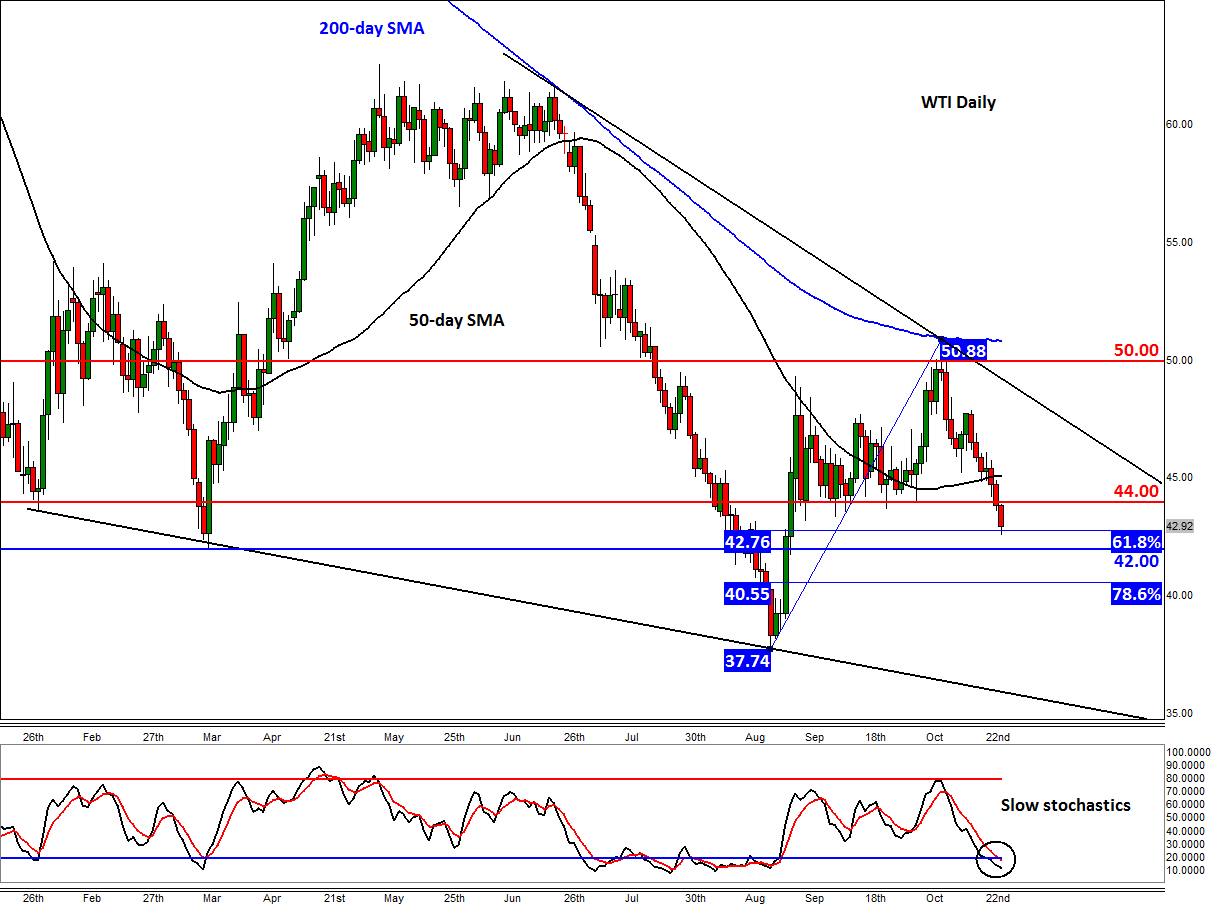
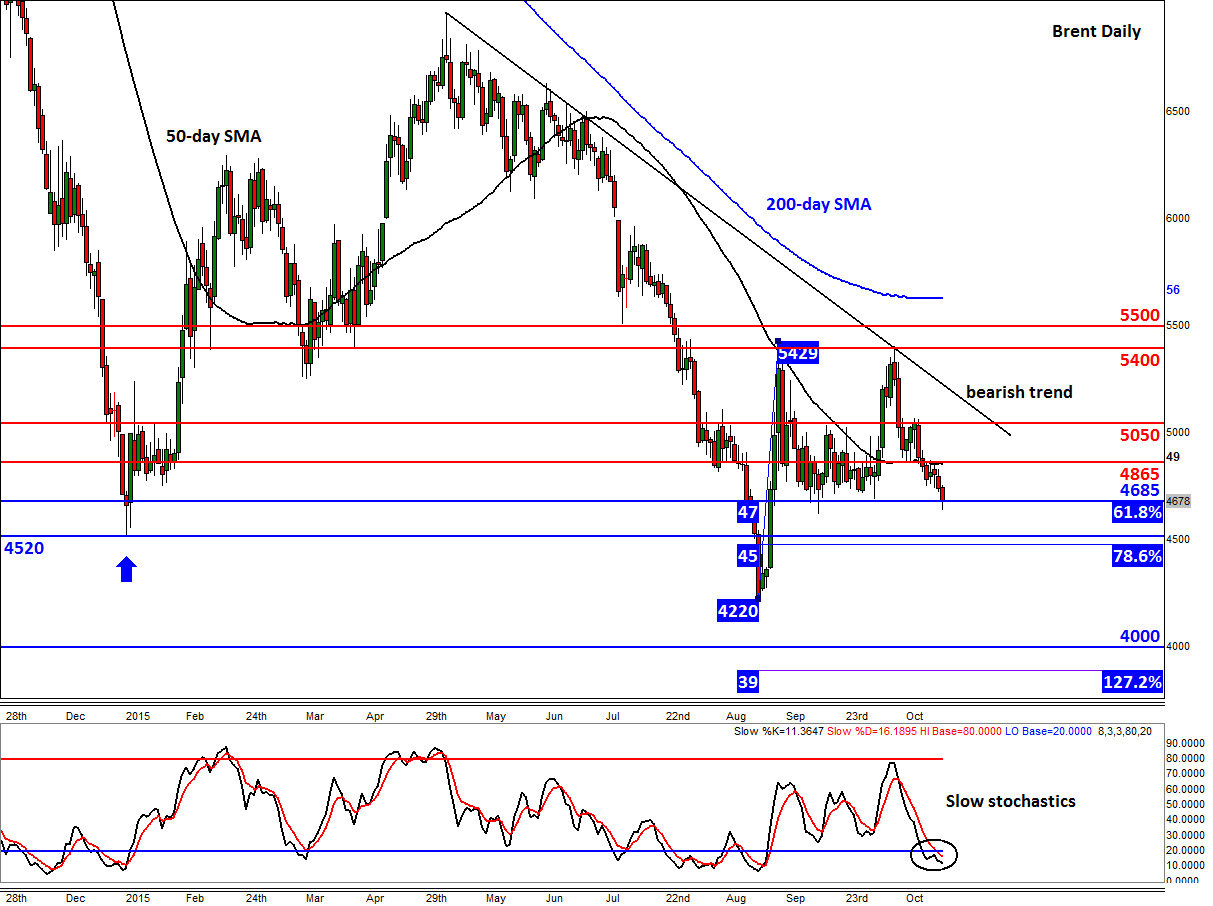
Both crude contracts have now reached some technically-important levels after a 2.5-week sell-off, namely the 61.8% Fibonacci retracements of the upswing from the August low. For Brent, this comes in around $46.85 while for WTI it is at $42.75. The 61.8% is among the most important of Fibonacci retracement levels. It is often used to provide an objective profit target, while under certain circumstances it could also be used as an ideal entry point in the opposite direction. In the case of oil, both Brent and WTI prices have been falling every day apart from three or four occasions since the last rally ran out of steam around the 9-10th October. Since then, Brent has fallen some 13 per cent while WTI has shed around 15%. Following such a vicious sell-off, it is likely that some of the existing sellers would be looking to book profit here. Bullish speculators meanwhile might be thinking that prices are oversold – as suggested, for example, by the slow stochastic momentum indicators – and may therefore step in here. There may also be a group of speculators who think oil prices have already bottomed out this year and this recent pullback is a perfect opportunity to go long after missing the initial rally at the end of August. Now, whether or not we have already seen a bottom is up for debate and unconfirmed at this stage, but for all the above reasons the probability of that we may see at least a short-term bounce here is now high.
However, should oil prices break decisively below the above-mentioned support levels, then further losses could follow in the coming days, although WTI’s next potential support, at $42.00, is not that far off now. Below $42 is the 78.6% retracement at $40.55 followed by the August low at $37.75. For Brent, the next support is around $45.00/20, followed by the August low at $42.20.
But for the short-term bias to turn bullish, both oil contracts will now need to break down some key resistance levels, starting with $44.00 on WTI and $48.65 for Brent. Until and unless we see that, any potential bounces here should be taken with a pinch of salt.
StoneX Financial Ltd (trading as “City Index”) is an execution-only service provider. This material, whether or not it states any opinions, is for general information purposes only and it does not take into account your personal circumstances or objectives. This material has been prepared using the thoughts and opinions of the author and these may change. However, City Index does not plan to provide further updates to any material once published and it is not under any obligation to keep this material up to date. This material is short term in nature and may only relate to facts and circumstances existing at a specific time or day. Nothing in this material is (or should be considered to be) financial, investment, legal, tax or other advice and no reliance should be placed on it.
No opinion given in this material constitutes a recommendation by City Index or the author that any particular investment, security, transaction or investment strategy is suitable for any specific person. The material has not been prepared in accordance with legal requirements designed to promote the independence of investment research. Although City Index is not specifically prevented from dealing before providing this material, City Index does not seek to take advantage of the material prior to its dissemination. This material is not intended for distribution to, or use by, any person in any country or jurisdiction where such distribution or use would be contrary to local law or regulation.
For further details see our full non-independent research disclaimer and quarterly summary.
CFDs are complex instruments and come with a high risk of losing money rapidly due to leverage. 69% of retail investor accounts lose money when trading CFDs with this provider. You should consider whether you understand how CFDs work and whether you can afford to take the high risk of losing your money. CFD and Forex Trading are leveraged products and your capital is at risk. They may not be suitable for everyone. Please ensure you fully understand the risks involved by reading our full risk warning.
City Index is a trading name of StoneX Financial Ltd. Head and Registered Office: 1st Floor, Moor House, 120 London Wall, London, EC2Y 5ET. StoneX Financial Ltd is a company registered in England and Wales, number: 05616586. Authorised and regulated by the Financial Conduct Authority. FCA Register Number: 446717.
City Index is a trademark of StoneX Financial Ltd.
The information on this website is not targeted at the general public of any particular country. It is not intended for distribution to residents in any country where such distribution or use would contravene any local law or regulatory requirement.
© City Index 2024