Copy of Singapore Banks Q3 Earnings Preview UOB Best Technical Pick
Singapore’s trio of banks; DBS, UOB and OCBC will start to report their respective Q3 2019 earnings data in the next three weeks. Dates and earnings forecasts are as follow:
|
Date |
Q2 Revenue |
Q3 Revenue (forecast) |
Q2 Earnings per share |
Q3 Earnings per share (forecast) |
|
|
UOB |
Fri, 01 Nov |
$2.58 billion |
$2.52 billion |
0.69 |
0.63 |
|
OCBC |
Tues, 05 Nov |
$2.62 billion |
$2.62 billion |
0.29 |
0.29 |
|
DBS |
Mon, 11 Nov |
$3.71 billion |
$3.62 billion |
0.63 |
0.60 |
* Data from Refinitiv & earnings announcements are released before market open
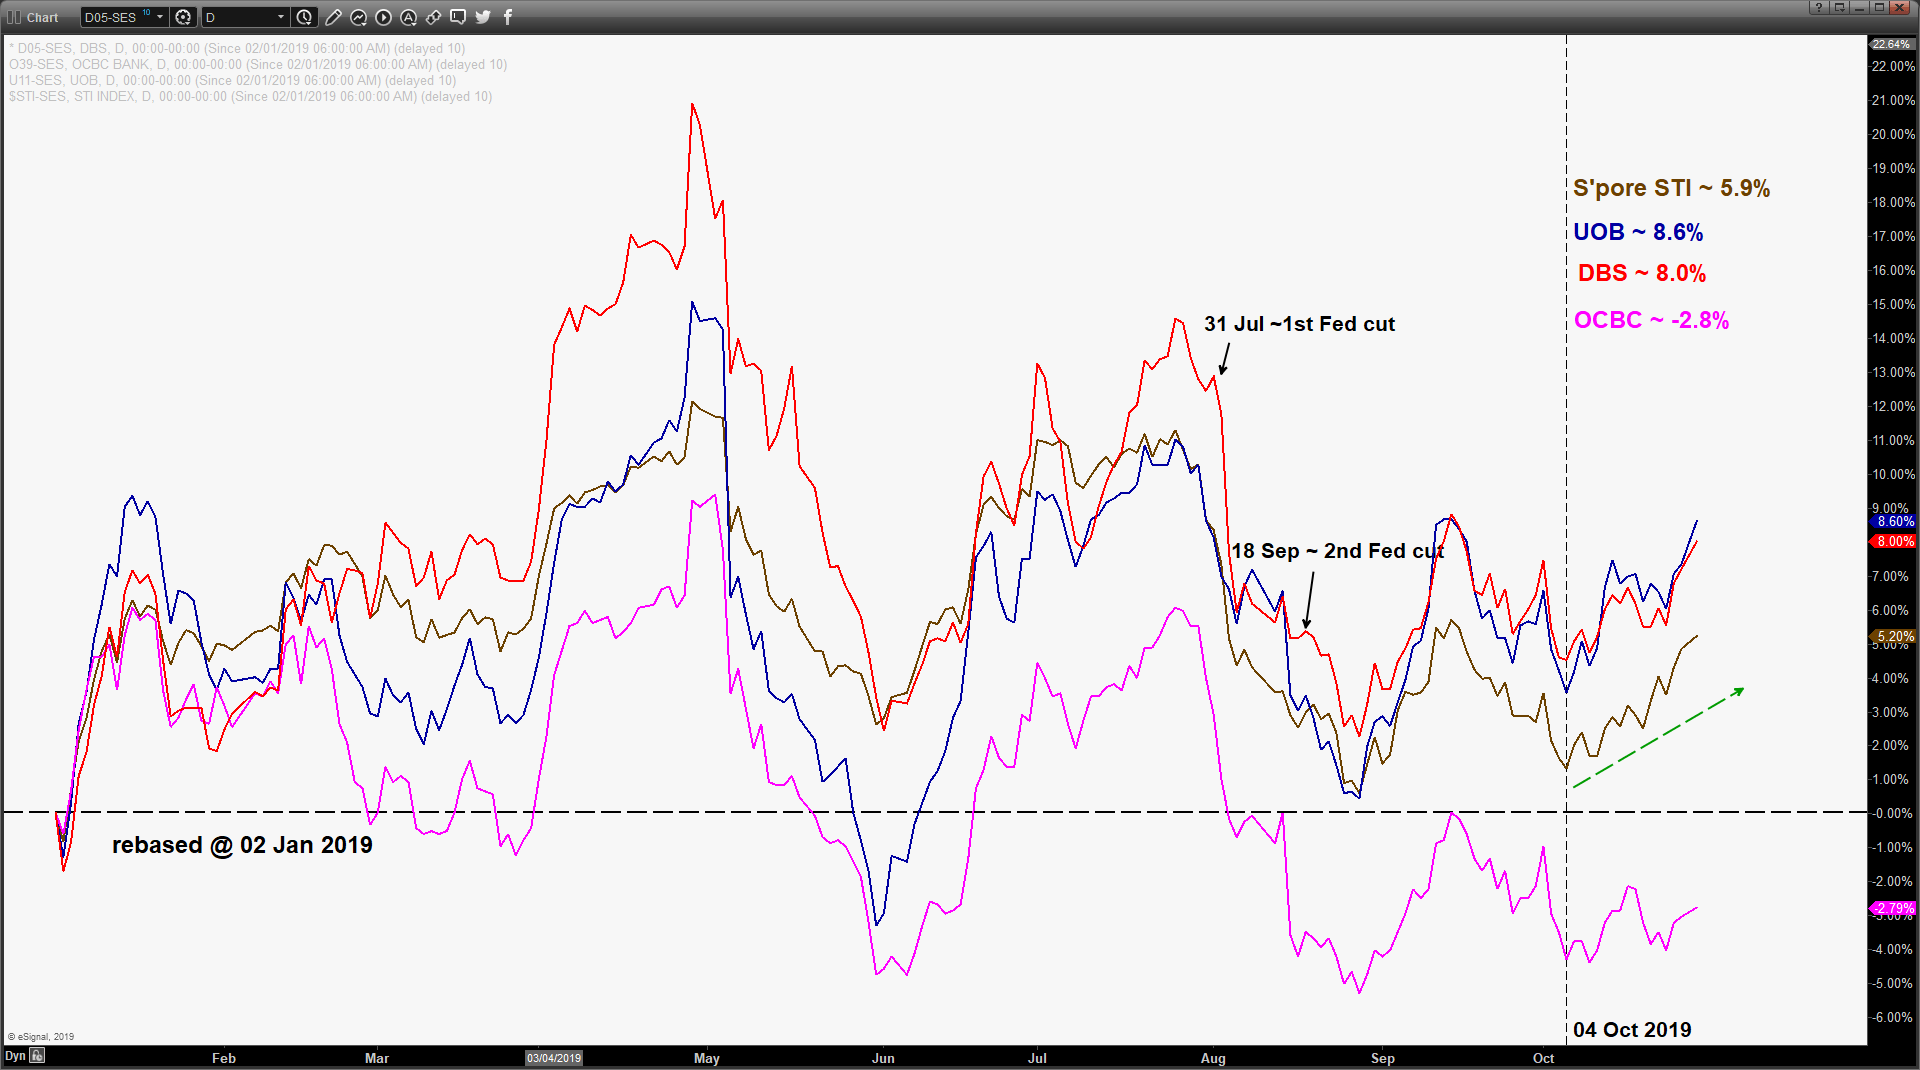
2019 year to date performance till 29 Oct
- The combined market capitalisation weightage of the three banks in the Singapore benchmark stock market index; the Straits Times Index (STI) stands at 40% approximately, a significant attribution that explains the tandem movement between the STI and the banks.
- The best performer so far is UOB which has gained 8.6% (exclude dividends) and the worst is OCBC that has shed -2.8%. Both DBS and UOB have outperformed the STI.
- One of the main catalysts for the lacklustre performance seen in OCBC share price was due to a deterioration in asset quality amid a global economic slowdown. In Q1 2019, OCBC has taken a one-off provision on its oil and gas loan portfolio due to its significant exposure to indebted crude oil supplier, Coastal Oil Singapore. New non-performing loans (NPL) formation were reported by OCBC in Q2 on its Indonesia crude palm oil plantation portfolio.
- In Q2, OCBC reported the lowest NPL coverage ratio at 61% while DBS and UOB ratios were at 90% and 76% respectively.
Q3 Tailwinds
- In Q2, income fees from wealth management products and advisory services had improved by 5% to 18% q/q across the three banks due to heightened demand for such products by investors seeking to navigate the tumultuous markets.
- Wealth management income should continue to provide support for Q3 earnings where investors now seek to preserve wealth in a low interest rate environment. In addition, potential new private banking inflows from North Asia due to the on-going domestic unrest in Hong Kong can drive up fees as well.
Q3 Headwinds
- In the first half 2019, net interest margin (NIM) growth has expanded by 1 bps to 7bps from Q4 2018 but such growth is unlikely to be sustainable in Q3 2019.
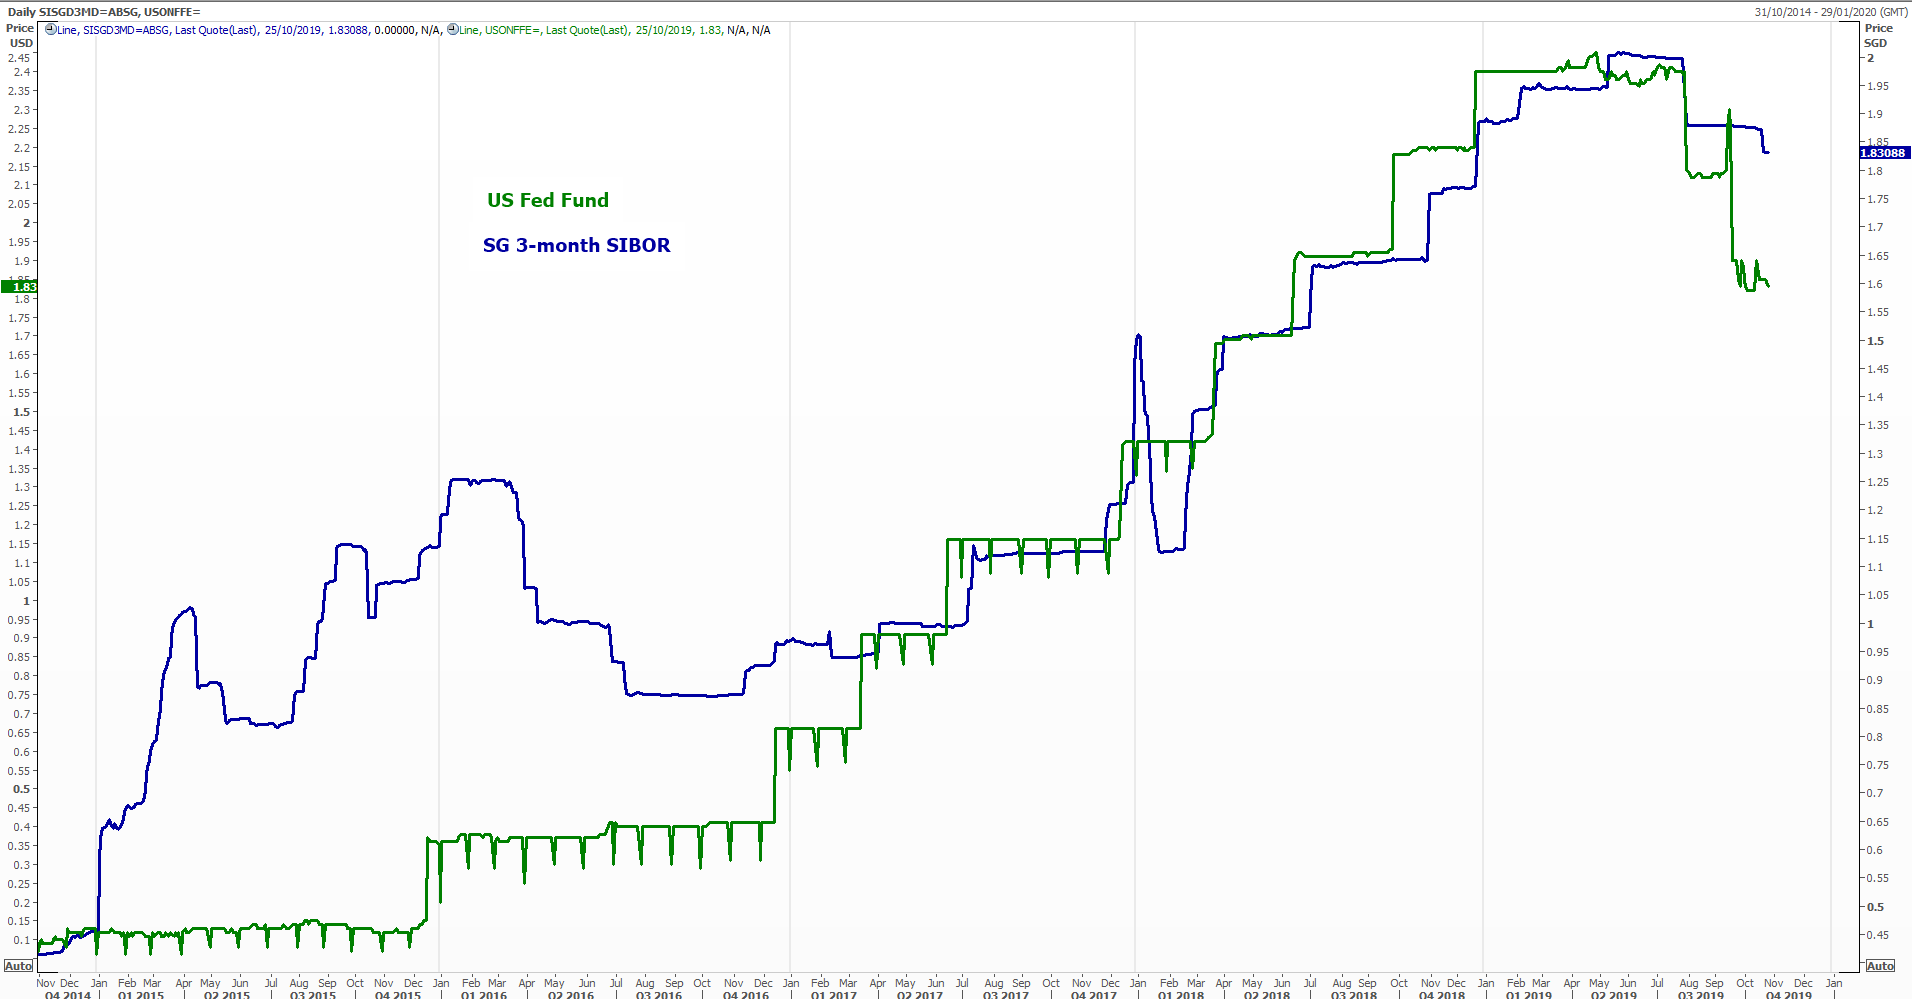
- Given the dovish stance taken by central banks to cut interest rates in 2H 2019, the 3-month SIBOR (Singapore Interbank Offer Rate), the benchmark interest rate for pricing of loans has drifted down in tandem with the U.S. Fed Fund rate since Jul 2019 (see chart below).
- Slower global economic growth especially in manufacturing activities caused by the on-going U.S-China trade tensions have dampened economic activities in Singapore. Singapore central bank, MAS has lowered its 2019 GDP growth forecast to 0% to 1.0% from 1.5% to 2.5% in its latest quarterly brief published in Sep.
- Thus, given such tougher macro conditions, credit costs may increase due to higher new NPL formation.
Best Technical Analysis Pick – UOB
click to enlarge charts
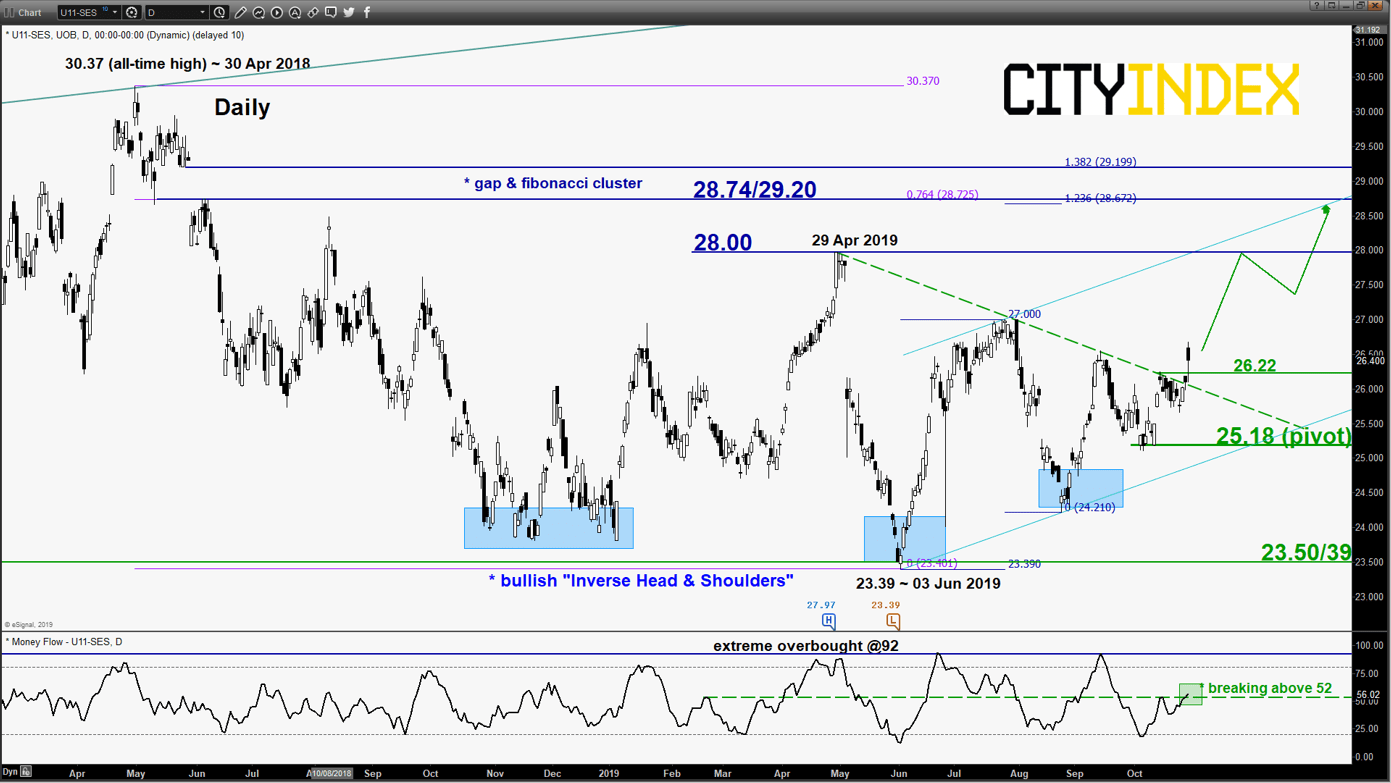
Key Levels (1 to 3 weeks)
Intermediate support: 26.22
Pivot (key support): 25.18
Resistances: 28.00 & 28.74/29.20
Next support: 23.50/39
Directional Bias (1 to 3 weeks)
Bullish bias in any dips above 25.18 key medium-term pivotal support for a potential push up to target 28.00 (close to 29 Apr 2019 swing high area) and 28.74/29.20 next.
On the other hand, a break with a daily close below 25.18 invalidates the bullish scenario for a choppy decline to retest the major support at 23.50/39.
Key elements
- The share prices of UOB, DBS and OCBC has continued to increase since 04 Oct 2019 in line with an uptick seen in the 10-year U.S. Treasury yield.
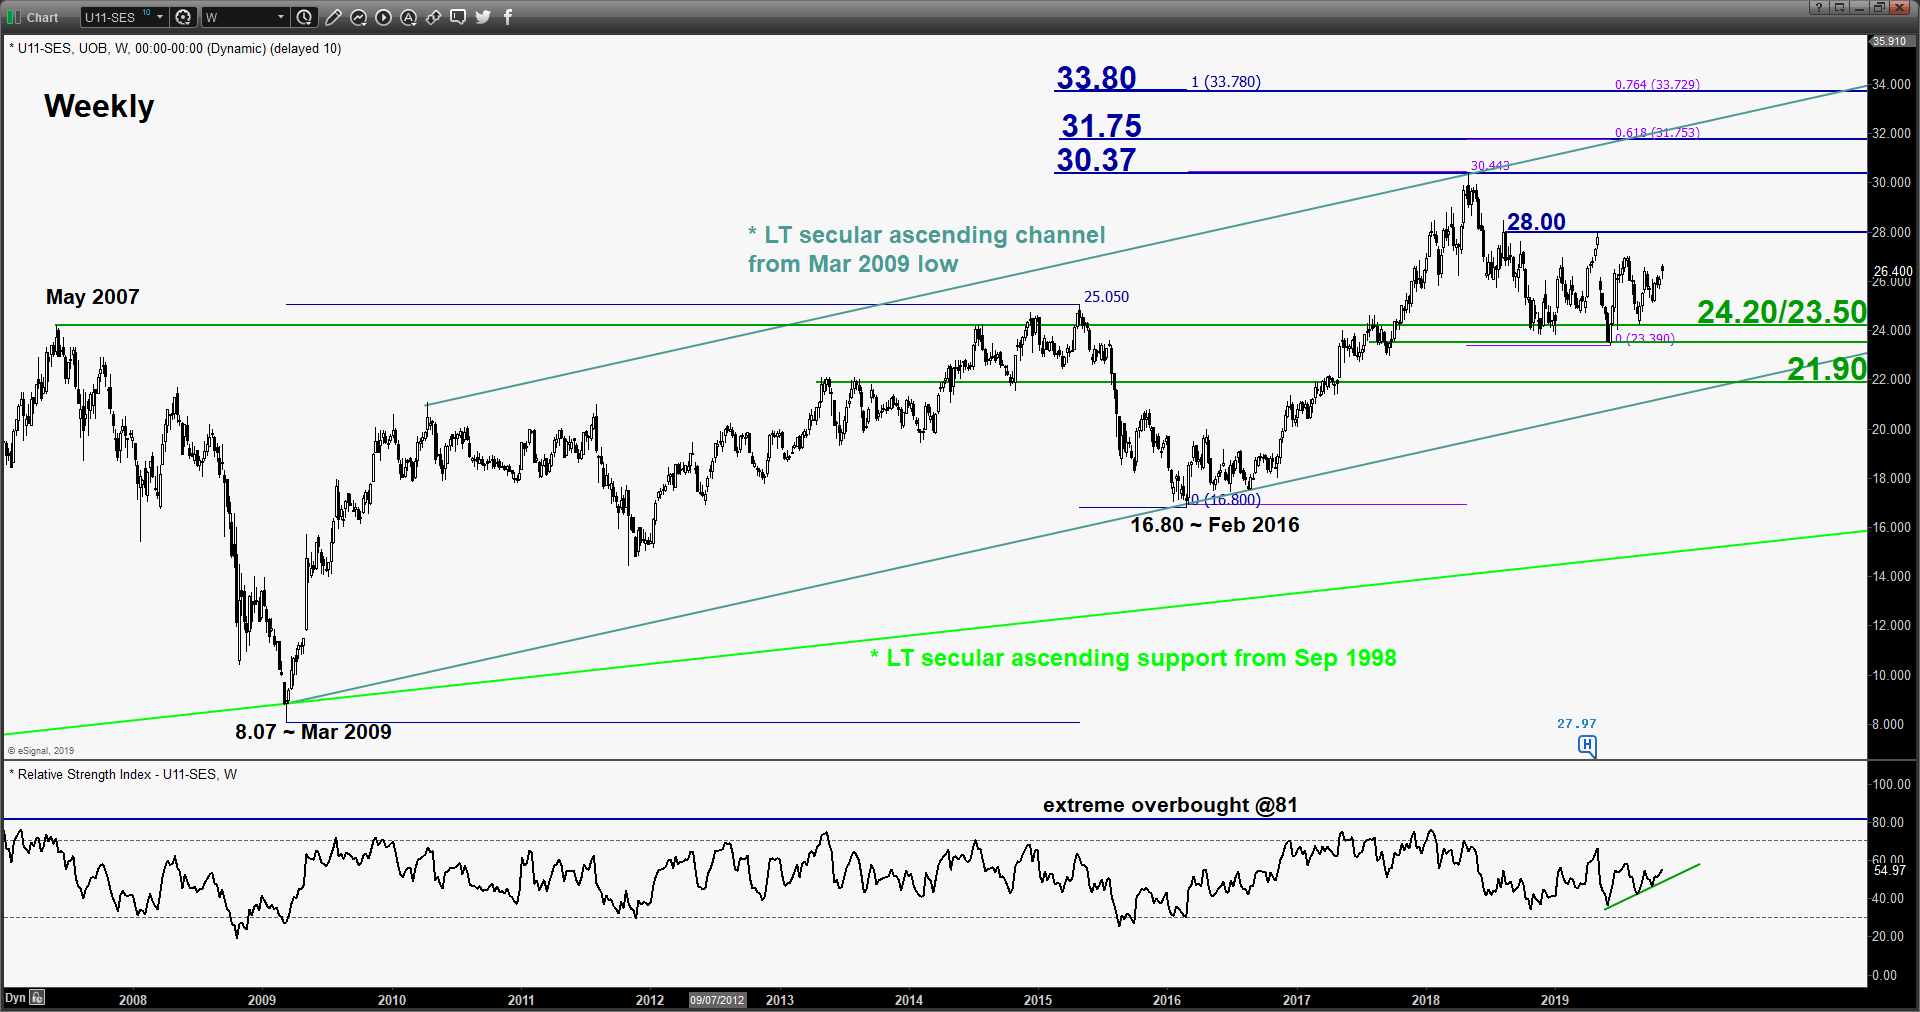
- Since its all-time high of 30.37 printed on 30 Aug 2018, the share price of UOB has declined by 22% to hit a low of 23.39 in Jun 2019. Thereafter, it has started to form a major bullish basing “Inverse Head & Shoulders” configuration with its neckline resistance at 28.00.
- Price action momentum and volume has started to show positive readings since 18 Oct 2019 where the daily Money Flow Index has staged a breakout above the 52 level after it reversed up from its oversold region. It still has further room to manoeuvre to the upside before it reaches an extreme overbought level at 92.
- Within the major basing “Inverse Head & Shoulders” configuration, the price action of UOB has started to evolve into a medium-term ascending channel since 03 Jun 2019 low with the lower boundary of the channel acting as a support at 25.18 (also the swing low areas of 03/11 Oct 2019).
- The significant medium-term resistance zone of 28.74/29.20 is defined by the gapped down formed on 28 May/30 May 2018, the upper boundary of the medium-term ascending channel and a Fibonacci retracement/expansion cluster.
Charts are from eSignal & Refinitiv
StoneX Financial Ltd (trading as “City Index”) is an execution-only service provider. This material, whether or not it states any opinions, is for general information purposes only and it does not take into account your personal circumstances or objectives. This material has been prepared using the thoughts and opinions of the author and these may change. However, City Index does not plan to provide further updates to any material once published and it is not under any obligation to keep this material up to date. This material is short term in nature and may only relate to facts and circumstances existing at a specific time or day. Nothing in this material is (or should be considered to be) financial, investment, legal, tax or other advice and no reliance should be placed on it.
No opinion given in this material constitutes a recommendation by City Index or the author that any particular investment, security, transaction or investment strategy is suitable for any specific person. The material has not been prepared in accordance with legal requirements designed to promote the independence of investment research. Although City Index is not specifically prevented from dealing before providing this material, City Index does not seek to take advantage of the material prior to its dissemination. This material is not intended for distribution to, or use by, any person in any country or jurisdiction where such distribution or use would be contrary to local law or regulation.
For further details see our full non-independent research disclaimer and quarterly summary.
CFDs are complex instruments and come with a high risk of losing money rapidly due to leverage. 69% of retail investor accounts lose money when trading CFDs with this provider. You should consider whether you understand how CFDs work and whether you can afford to take the high risk of losing your money. CFD and Forex Trading are leveraged products and your capital is at risk. They may not be suitable for everyone. Please ensure you fully understand the risks involved by reading our full risk warning.
City Index is a trading name of StoneX Financial Ltd. Head and Registered Office: 1st Floor, Moor House, 120 London Wall, London, EC2Y 5ET. StoneX Financial Ltd is a company registered in England and Wales, number: 05616586. Authorised and regulated by the Financial Conduct Authority. FCA Register Number: 446717.
City Index is a trademark of StoneX Financial Ltd.
The information on this website is not targeted at the general public of any particular country. It is not intended for distribution to residents in any country where such distribution or use would contravene any local law or regulatory requirement.
© City Index 2024