Copy of OCBC Bank Upside momentum is losing strength ahead of earnings
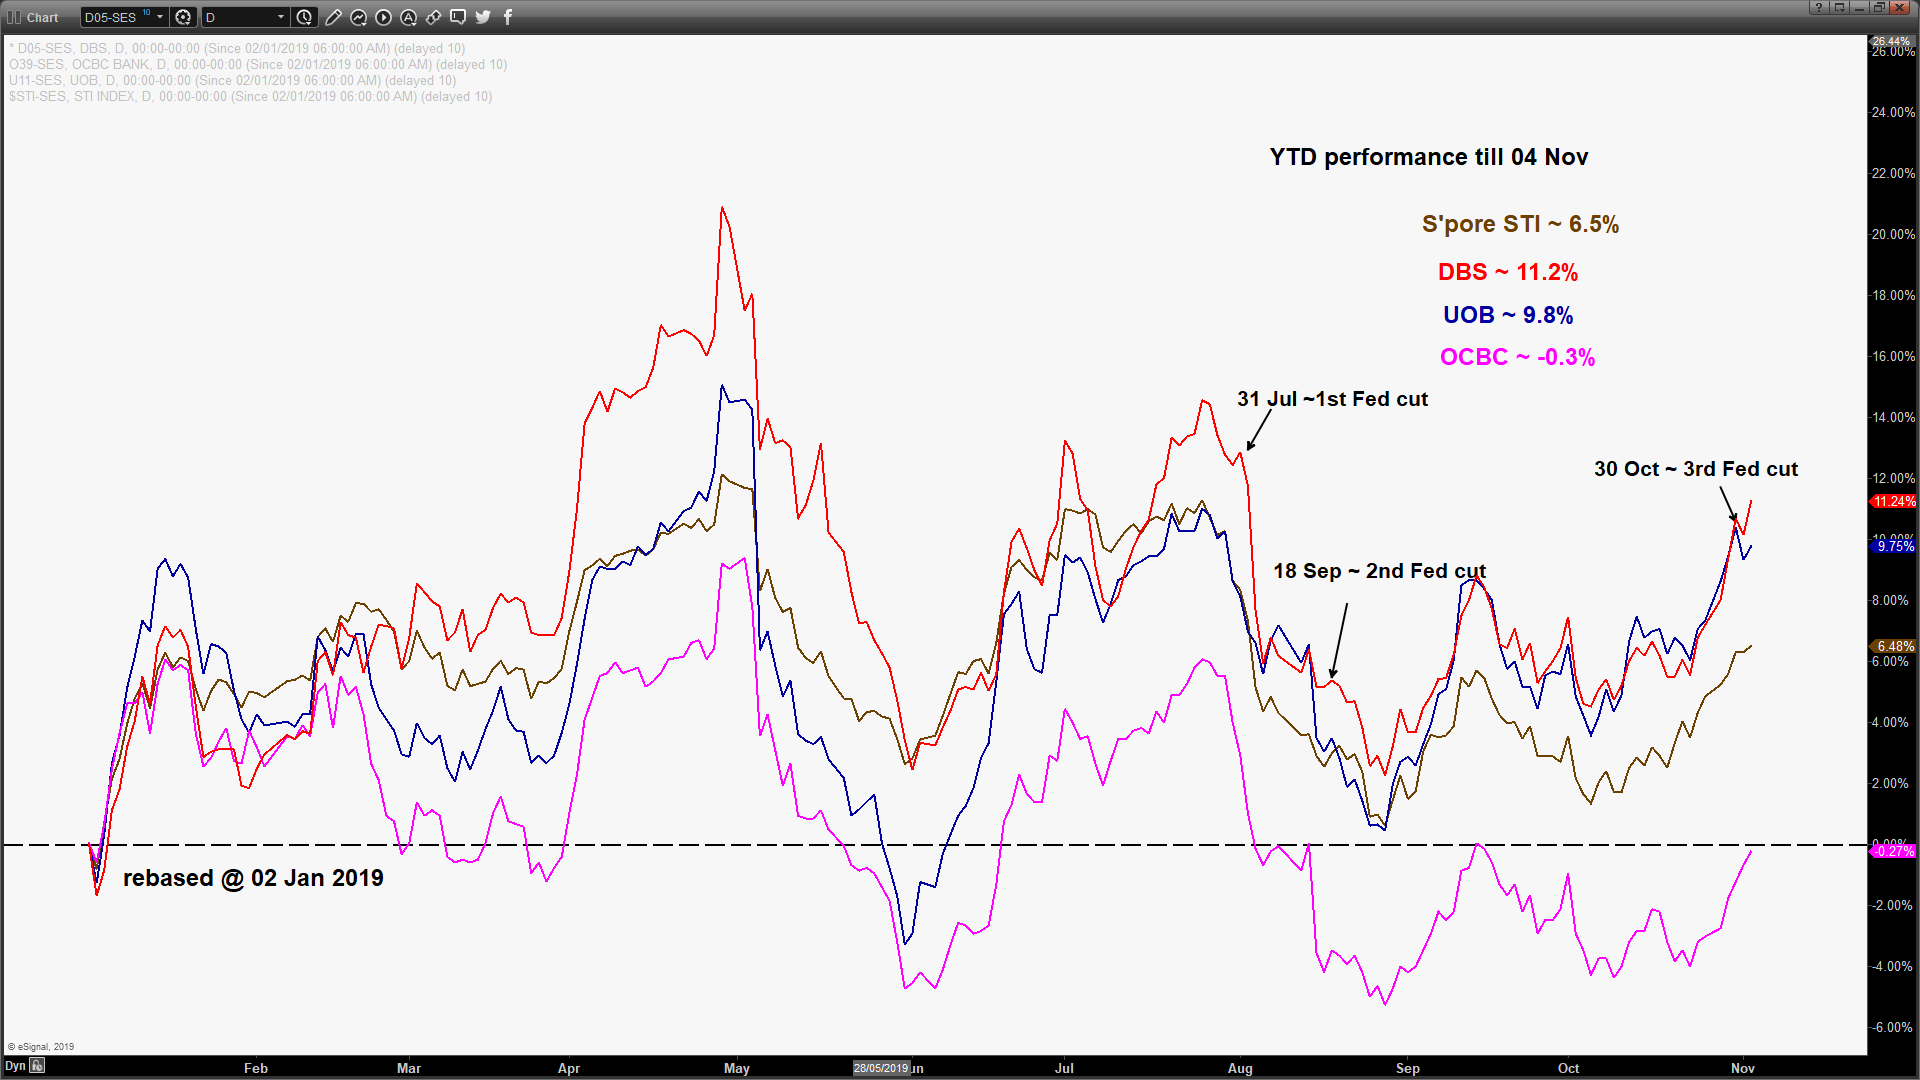
Overseas-Chinese Banking Corporation (OCBC), one of the big 3 Singapore banks will release its Q3 earnings on Tues, 05 Nov before the market open. An earnings preview brief on the Singapore banks has been published earlier last week (click here for a recap).
Right now, let us look at OCBC from a technical analysis perspective based on its latest price action.
Medium-term technical outlook on OCBC Bank
click to enlarge charts
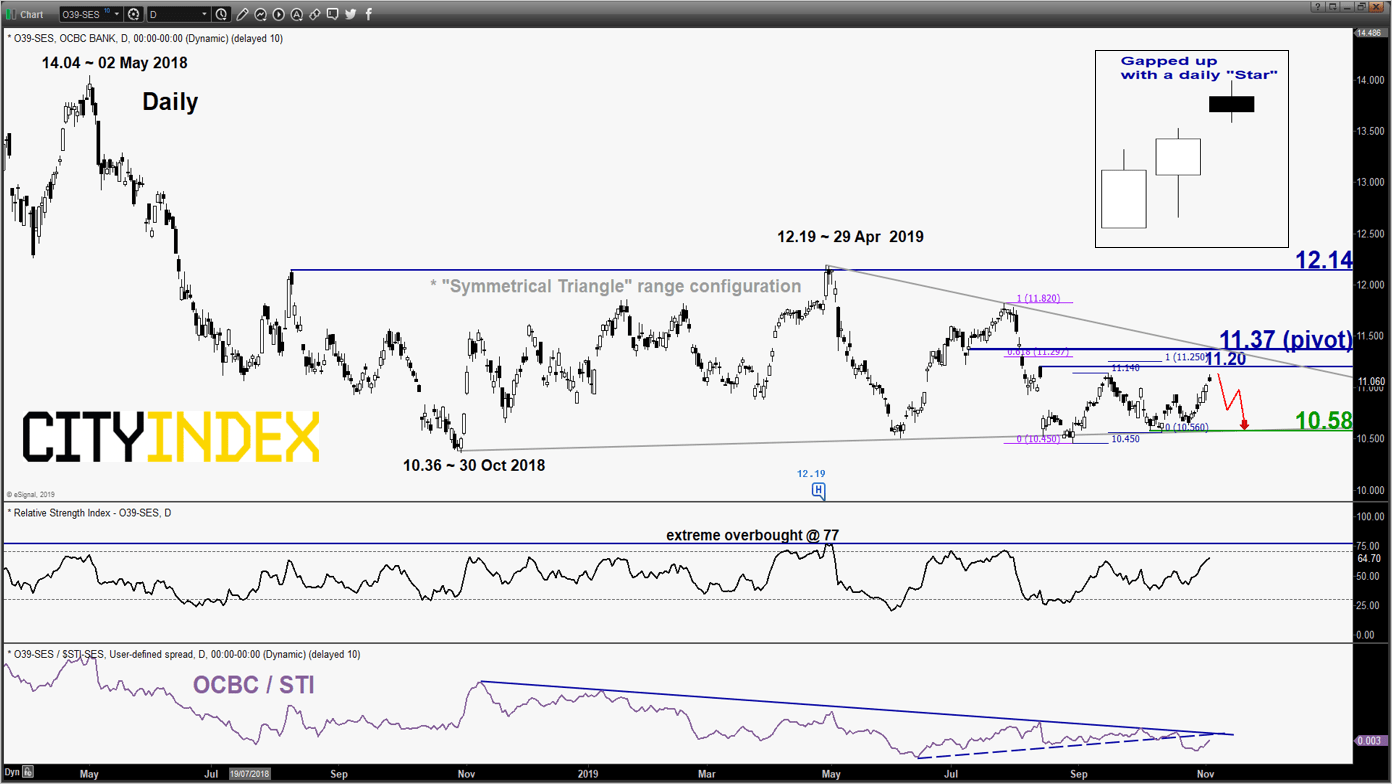
Key Levels (1 to 3 weeks)
Intermediate resistance: 11.20
Pivot (key resistance): 11.37
Support: 10.58
Resistance: 12.14
Directional Bias (1 to 3 weeks)
Bearish bias below 11.37 key medium-term pivotal resistance for a potential slide to retest the “Symmetrical Triangle” range support at 10.58.
On the other hand, a clearance with a daily close above 11.37 sees a further potential up move towards the major range resistance at 12.14 (swing high areas of 08 Aug 2018/29 Apr 2019).
Key elements
- Since its 30 Oct 2018 low of 10.36, OCBC has been evolving within a “Symmetrical Triangle” range configuration with its upper limit acting as a resistance at 11.37.
- The “Symmetrical Triangle” range resistance of 11.37 also confluences with a gapped down formed on 01/02 Aug 2019 and the 61.8% Fibonacci retracement of the recent slide from 25 Jul 2019 low to 29 Aug 2019 high.
- The daily RSI oscillator is now hovering close to an extreme overbought level of 77 which indicates the risk of a mean reversion decline has increased.
- The price action has formed a daily “Star” candlestick pattern at the end of today session, 04 Nov after a gapped up seen at the open. This observation suggests that the bulls are becoming indecisive to push prices higher due to a relative smaller price action range that has formed today in comparison with the previous 3 sessions. Thus, the recent push up from 23 Oct 2018 swing low of 10.63 may be losing upside momentum and at risk of shaping a downside reversal.
- Relative strength analysis as seen from the ratio chart has indicated underperformance of OCBC against the benchmark Straits Times Index (STI).
Charts are from eSignal
StoneX Financial Ltd (trading as “City Index”) is an execution-only service provider. This material, whether or not it states any opinions, is for general information purposes only and it does not take into account your personal circumstances or objectives. This material has been prepared using the thoughts and opinions of the author and these may change. However, City Index does not plan to provide further updates to any material once published and it is not under any obligation to keep this material up to date. This material is short term in nature and may only relate to facts and circumstances existing at a specific time or day. Nothing in this material is (or should be considered to be) financial, investment, legal, tax or other advice and no reliance should be placed on it.
No opinion given in this material constitutes a recommendation by City Index or the author that any particular investment, security, transaction or investment strategy is suitable for any specific person. The material has not been prepared in accordance with legal requirements designed to promote the independence of investment research. Although City Index is not specifically prevented from dealing before providing this material, City Index does not seek to take advantage of the material prior to its dissemination. This material is not intended for distribution to, or use by, any person in any country or jurisdiction where such distribution or use would be contrary to local law or regulation.
For further details see our full non-independent research disclaimer and quarterly summary.
CFDs are complex instruments and come with a high risk of losing money rapidly due to leverage. 69% of retail investor accounts lose money when trading CFDs with this provider. You should consider whether you understand how CFDs work and whether you can afford to take the high risk of losing your money. CFD and Forex Trading are leveraged products and your capital is at risk. They may not be suitable for everyone. Please ensure you fully understand the risks involved by reading our full risk warning.
City Index is a trading name of StoneX Financial Ltd. Head and Registered Office: 1st Floor, Moor House, 120 London Wall, London, EC2Y 5ET. StoneX Financial Ltd is a company registered in England and Wales, number: 05616586. Authorised and regulated by the Financial Conduct Authority. FCA Register Number: 446717.
City Index is a trademark of StoneX Financial Ltd.
The information on this website is not targeted at the general public of any particular country. It is not intended for distribution to residents in any country where such distribution or use would contravene any local law or regulatory requirement.
© City Index 2024