Copy of Contrasting Fortunes For Capitaland Sun Hung Kai Properties
Both Hong Kong and Singapore are considered major financial centres in the Asia Pacific region coupled with significant investment inflows into their respective property markets as well.
The recent on-going domestic unrest in Hong Kong since Jun 2019 has crippled its economy and hampered Hong Kong’s ranking as a top preferred choice for property related investments. Thus, Singapore based property developers are likely benefit from this outcome as flows are being diverted to Singapore from Hong Kong.
We will be focusing on two major property developers from each region (Capitaland – Singapore & Sun Hung Kai – Hong Kong) that have similar business models with interest in residential and commercial projects from a technical analysis perspective.
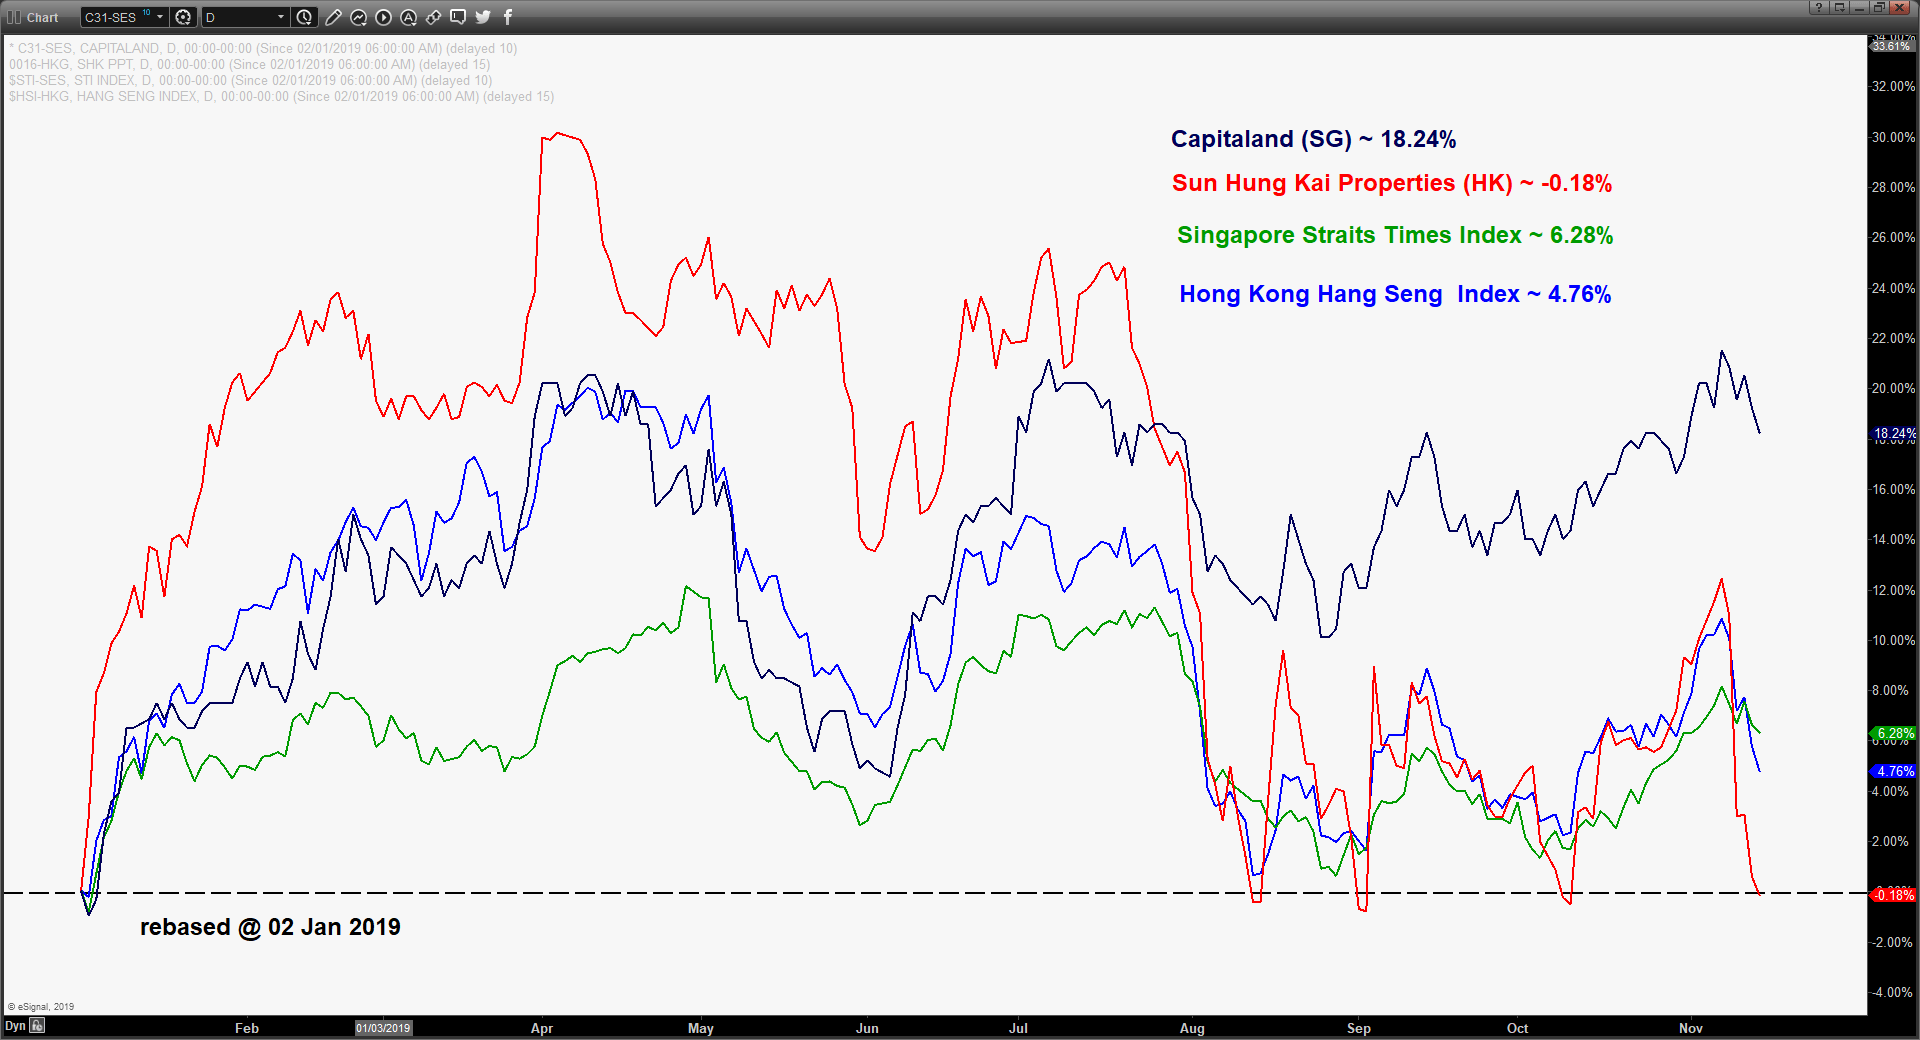
2019 year to date performance of Sun Hung Kai Properties & Capitaland till 13 Nov 2019
Sun Hung Kai Properties (HK property stock/0016 HKG) – Further potential drop
click to enlarge chart
Key Levels (1 to 3 weeks)
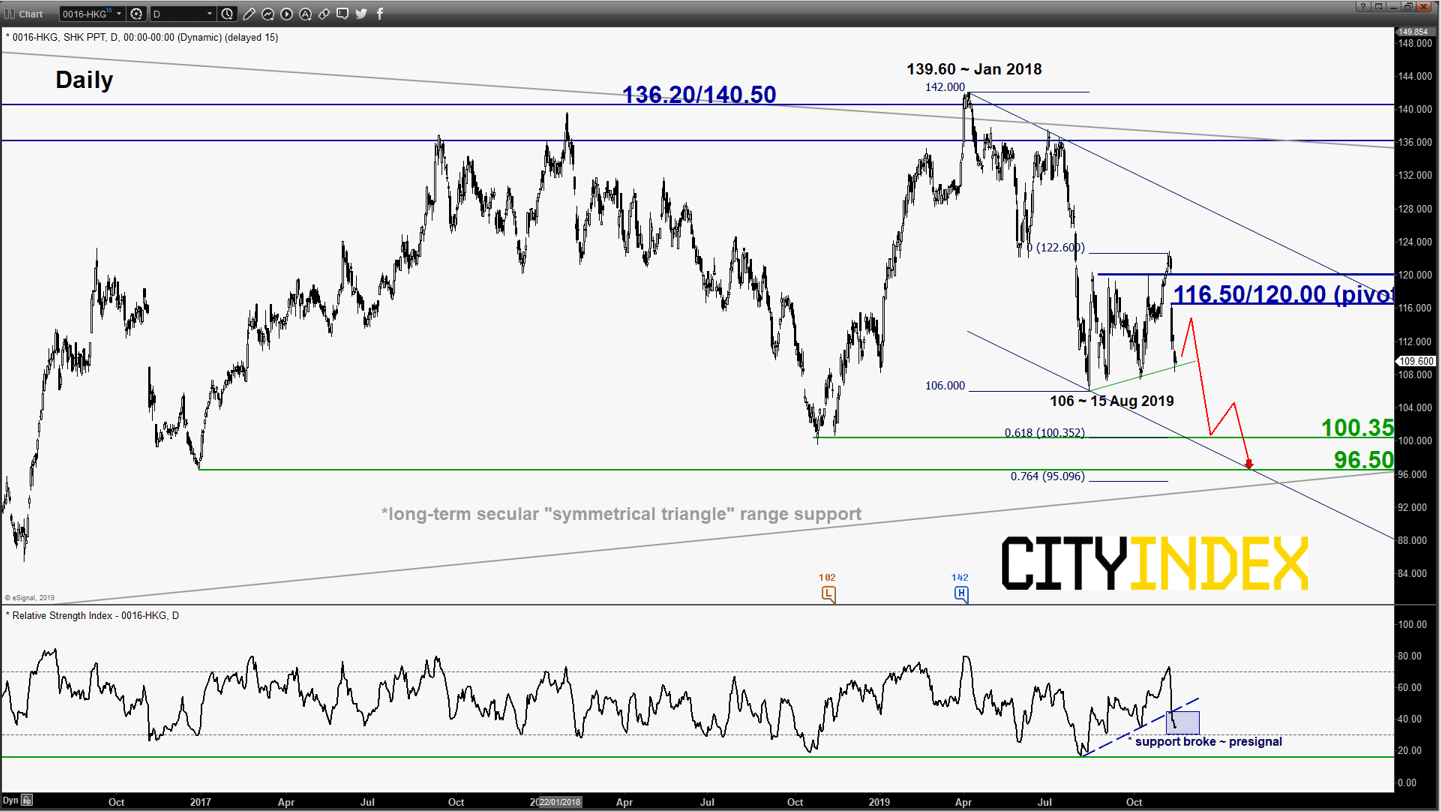
Pivot (key resistance): 116.50/120.00
Supports: 100.35 & 96.50
Next resistance: 136.20/140.50
Directional Bias (1 to 3 weeks)
Bearish bias in any bounces below 116.50/120.00 key pivotal resistance for a further potential decline to target the next supports at 100.35 and 96.50 within a long-term secular “Symmetrical Triangle” range configuration.
However, a clearance with a daily close above 120.00 invalidates the bearish scenario for another round of corrective rebound to retest 136.20/140.50 (secular “Symmetrical Triangle” range resistance & Jan 2018 swing high area).
Key elements
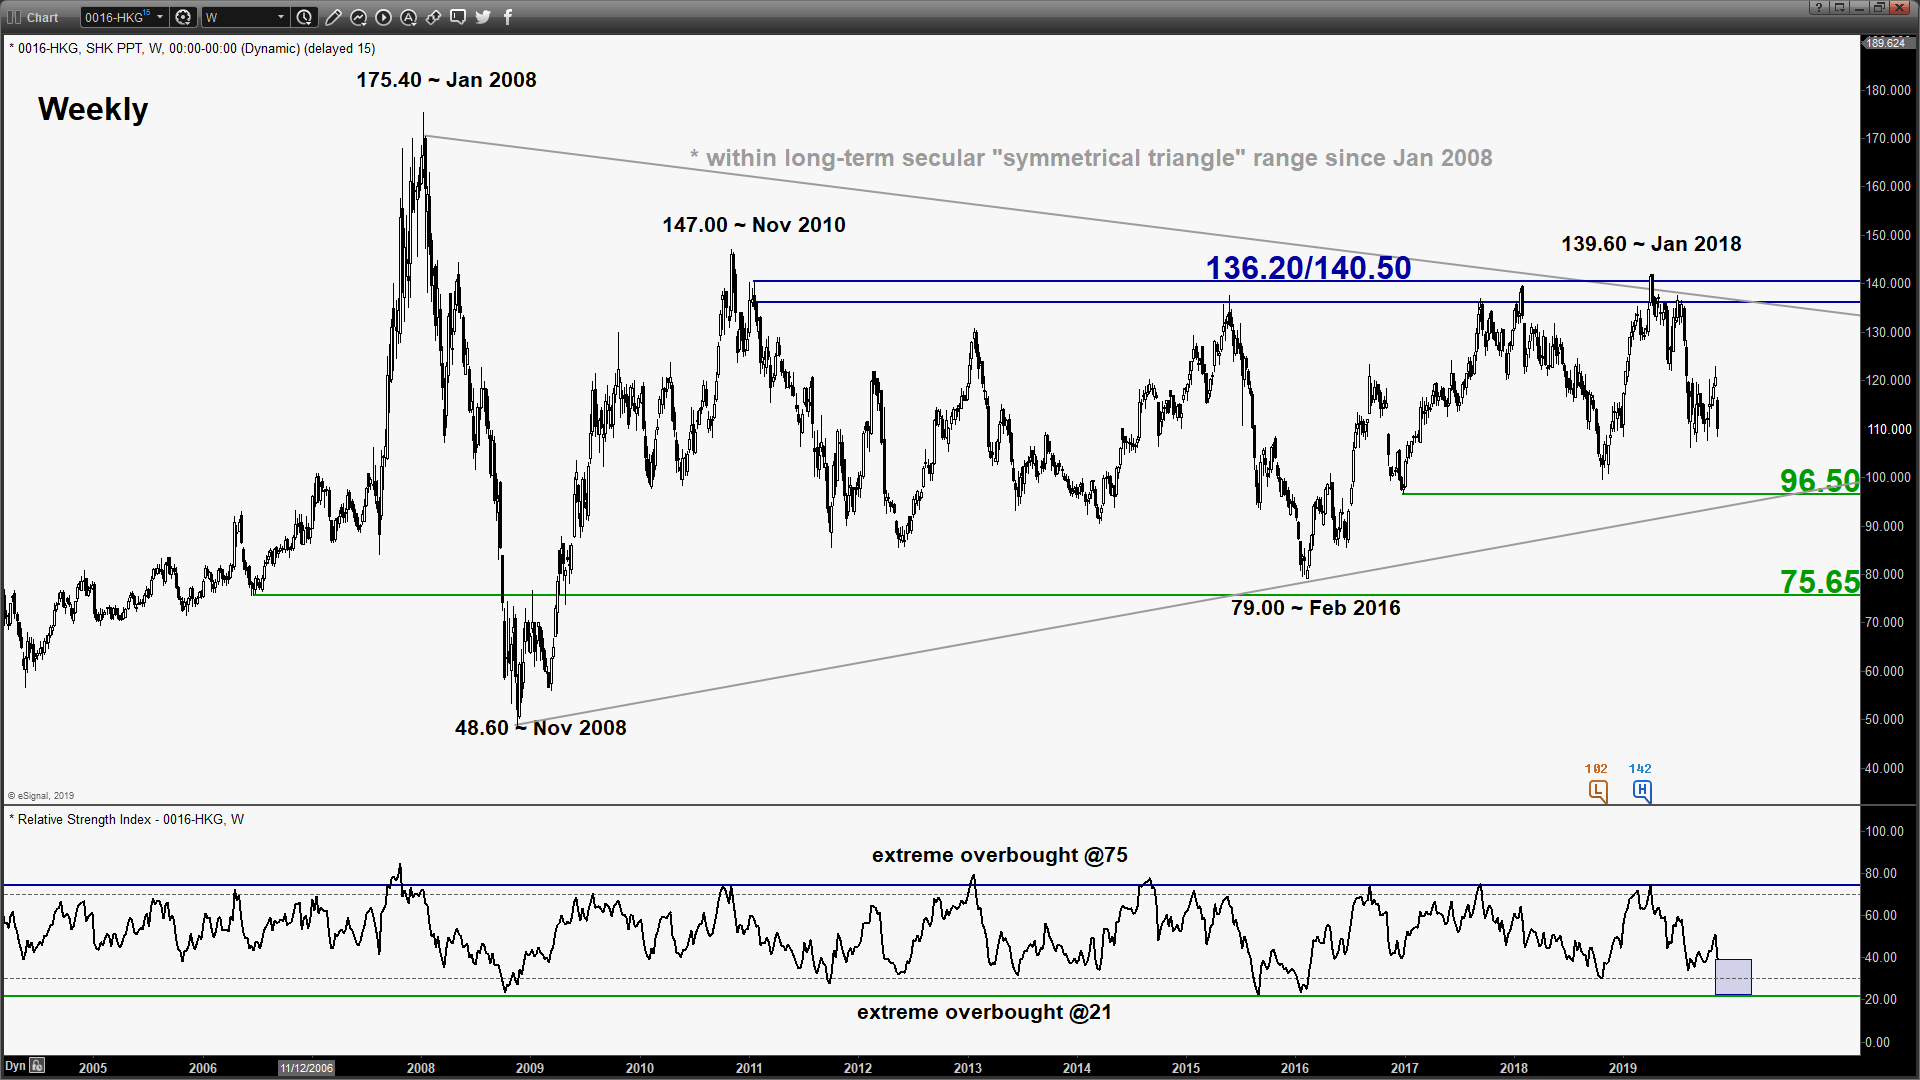
- The share price of Sun Hung Kai Properties has been evolving within a long-term secular “Symmetrical Triangle” range configuration since its Jan 20008 all-time high of 175.40 with upper limit/resistance at 136.20/140.50 and lower limit/support at 96.50.
- In the medium-term, it has been trading within a descending channel in place since 08 Apr 2019 high of 142.00 with downside momentum remains intact. The daily RSI oscillator has staged a bearish breakdown below its corresponding ascending support from its oversold level in parallel with the price action support from 15 Aug 2019 low of 106.00. This observation indicates a presignal of a potential breakdown on the price action support.
- The key medium-term pivotal resistance of 116.50/120.00 is defined by the gapped down on 11 Nov 2019 and the 61.8% Fibonacci retracement of the on-going drop from 07 Nov high to 13 Nov 2019 low.
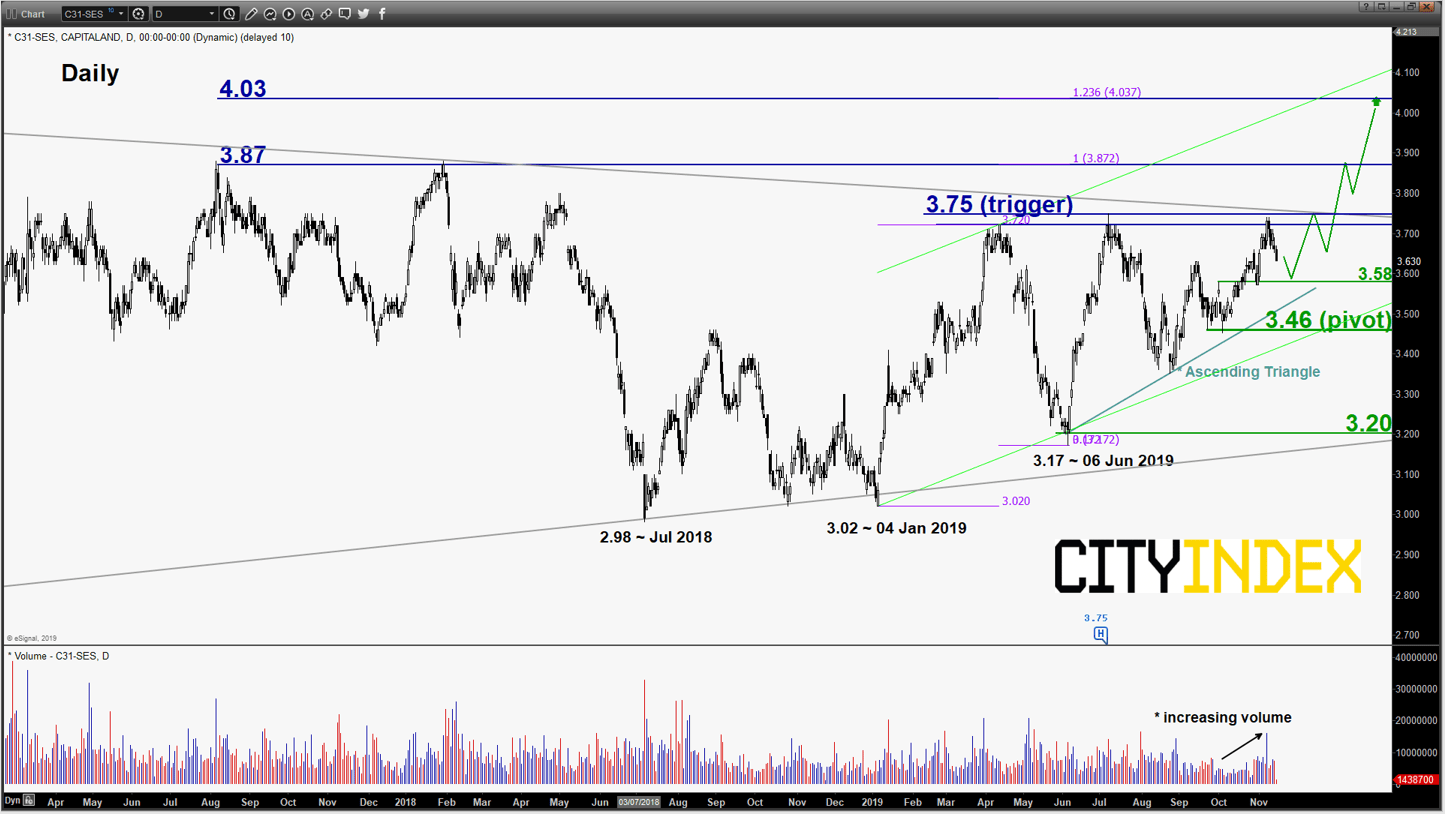
Capitaland (SG property stock/C31 SGX) – Potential bullish breakout from 10-year range
click to enlarge charts
Key Levels (1 to 3 weeks)
Intermediate support: 3.58
Pivot (key support): 3.46
Resistances: 3.75 (trigger), 3.87 & 4.03
Next support: 3.20
Directional Bias (1 to 3 weeks)
Bullish bias in any dips above 3.46 key pivotal support and a break with a daily close above 3.75 is likely to trigger a potential bullish breakout from its 7-month “Ascending Triangle” range configuration in place since 10 Apr 2019 high to target the next resistances at 3.87 and 4.03
On the other hand, failure to hold at 3.46 negates the bullish tone a slide back to retest the long-term secular “Symmetrical Triangle” range support at 3.20.
Key elements
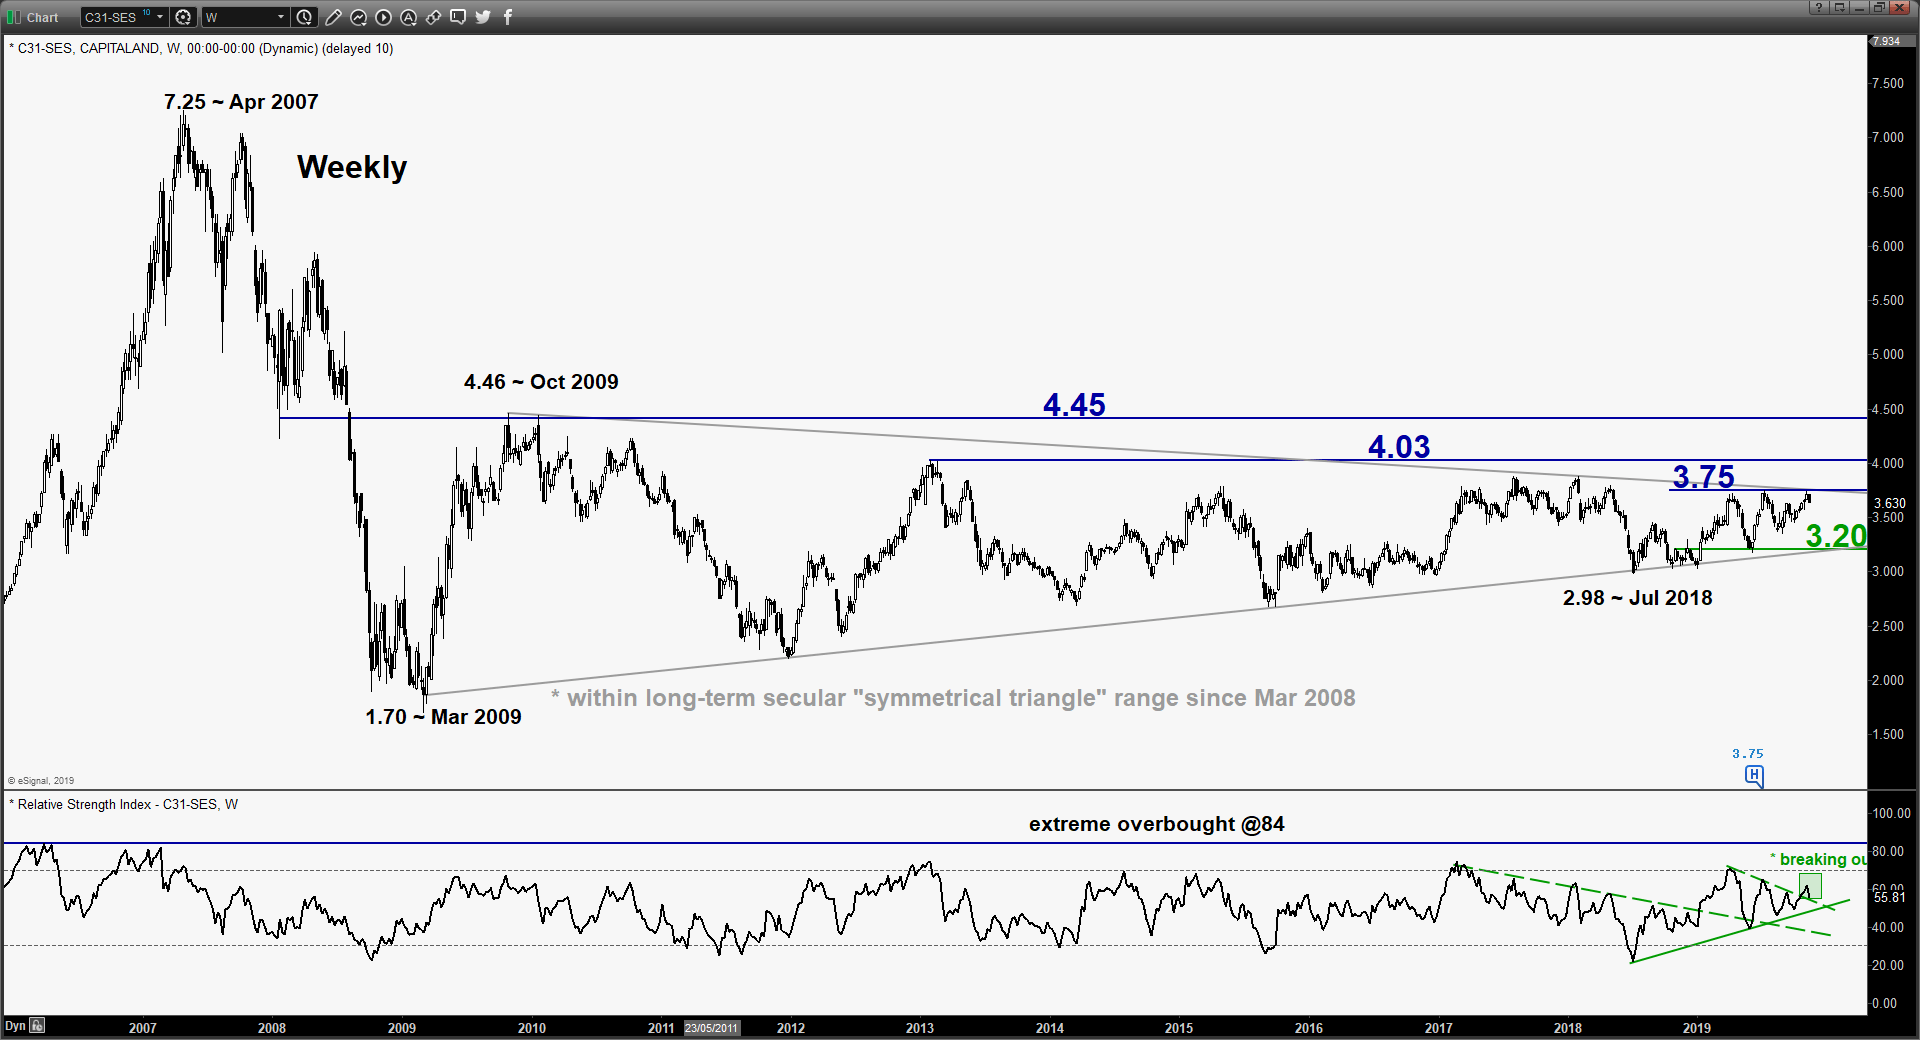
- The share price of Capitaland has been evolving within a long-term secular “Symmetrical Triangle” range configuration since Mar 2009 low of 1.70 with upper limit/resistance at 3.75 and lower limit/support at 3.20
- The weekly RSI oscillator has staged a bullish breakout from a recent corresponding descending resistance in parallel with the price action swing high area of Apr 2019. In conjunction, the recent up move in price action from 26 Aug low to 07 Nov 2019 high has been accompanied by an increasing volume. These observations suggest that medium-term upside momentum has resurfaced that increases the odds of a bullish breakout from the “Ascending Triangle” range configuration in place since 06 Jun 2019 low.
- The key medium-term pivotal support is defined by “Ascending Triangle” range support and a Fibonacci retracement cluster.
Charts are from eSignal
StoneX Financial Ltd (trading as “City Index”) is an execution-only service provider. This material, whether or not it states any opinions, is for general information purposes only and it does not take into account your personal circumstances or objectives. This material has been prepared using the thoughts and opinions of the author and these may change. However, City Index does not plan to provide further updates to any material once published and it is not under any obligation to keep this material up to date. This material is short term in nature and may only relate to facts and circumstances existing at a specific time or day. Nothing in this material is (or should be considered to be) financial, investment, legal, tax or other advice and no reliance should be placed on it.
No opinion given in this material constitutes a recommendation by City Index or the author that any particular investment, security, transaction or investment strategy is suitable for any specific person. The material has not been prepared in accordance with legal requirements designed to promote the independence of investment research. Although City Index is not specifically prevented from dealing before providing this material, City Index does not seek to take advantage of the material prior to its dissemination. This material is not intended for distribution to, or use by, any person in any country or jurisdiction where such distribution or use would be contrary to local law or regulation.
For further details see our full non-independent research disclaimer and quarterly summary.
CFDs are complex instruments and come with a high risk of losing money rapidly due to leverage. 69% of retail investor accounts lose money when trading CFDs with this provider. You should consider whether you understand how CFDs work and whether you can afford to take the high risk of losing your money. CFD and Forex Trading are leveraged products and your capital is at risk. They may not be suitable for everyone. Please ensure you fully understand the risks involved by reading our full risk warning.
City Index is a trading name of StoneX Financial Ltd. Head and Registered Office: 1st Floor, Moor House, 120 London Wall, London, EC2Y 5ET. StoneX Financial Ltd is a company registered in England and Wales, number: 05616586. Authorised and regulated by the Financial Conduct Authority. FCA Register Number: 446717.
City Index is a trademark of StoneX Financial Ltd.
The information on this website is not targeted at the general public of any particular country. It is not intended for distribution to residents in any country where such distribution or use would contravene any local law or regulatory requirement.
© City Index 2024